Nasdaq long-term update
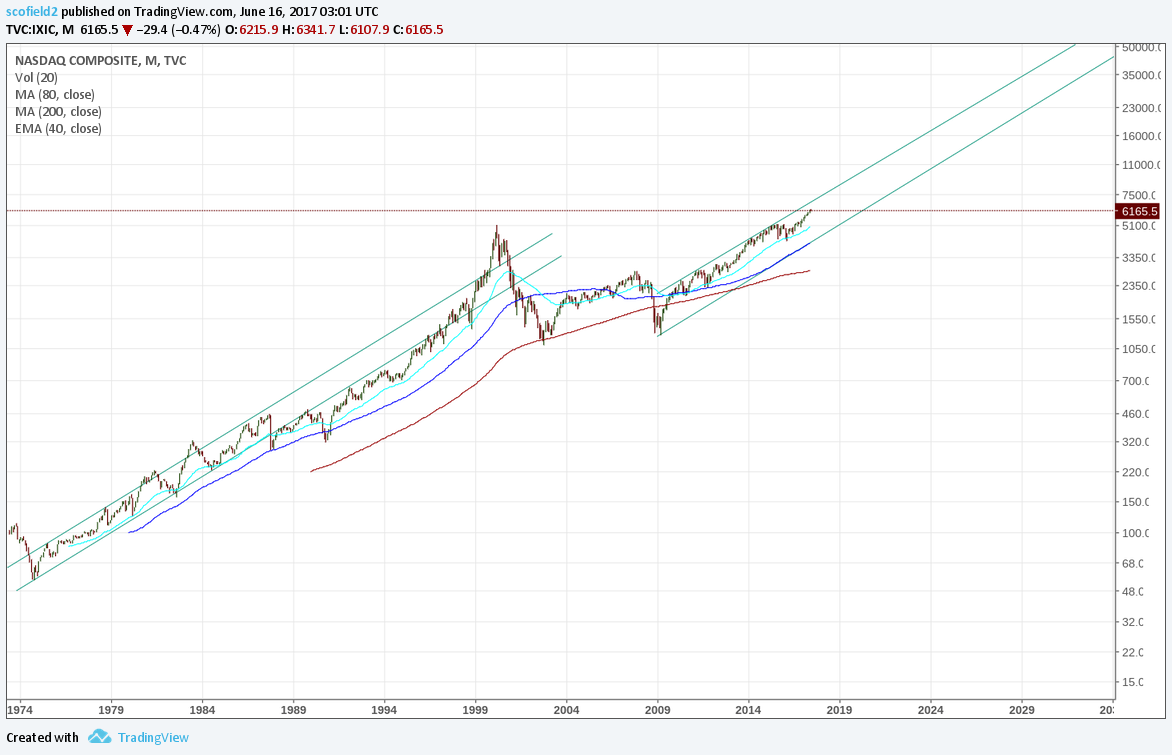
Here is what the nasdaq composite looks like on a long-term chart. Note the 40-month ema has been providing support for the corrections in the current bull-market just like in the previous bull-market.
There is a fractal between 1987-1990 and 2003-2009 looking at how the price interacts with the moving averages