JPY/USD = GOLD Relationship Theory
This ‘anomaly’ has been bugging me for some time however today I had an epiphany (or a stroke, you decide).
Driver of YEN 1) What would cause the YEN to go up suddenly in local terms (includes a lot of South East Asia) – i.e. local flight to safety out of Japanese stocks/real estate BOJ bonds etc. and into CASH (read YEN). One caveat, I’m thinking in LOCAL terms, not international FX movement which of course also moves currency. Additionally, would I expect to see any movement in the demand for Gold (a portion of the flight to safety from fiat to Gold – again from local curency)?
Driver of USD 2) Same as above except for the USD in local terms…i.e. local flight to safety and how (to what degree) might this be manifest in the price of Gold (in USD terms).
So, to neutralize the risk-on alternatives to local currencies (equities), against Gold I wanted to see what similarities in a ‘flight to safety’ scenario there might be.
S&P500/GOLD ratio
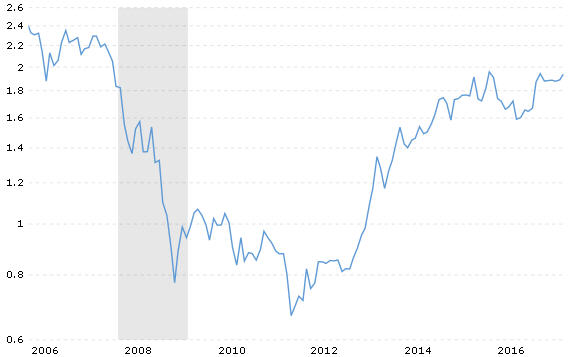
courtesy macrotrends.com
Nothing new there – BTW I only charted since 2006 since that was a recent point of market ‘stability’ – that and the fact that the second chart below I could only get for the same period.
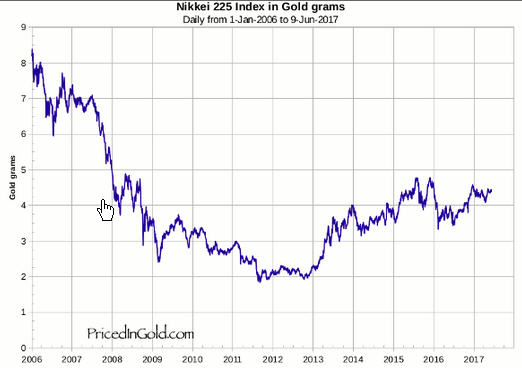
courtesy pricedingold.com
Ignoring gold oz/gram and the log/linear disparity, note closely correlated movement that both stock markets have against GOLD. Had you not known, they might be mistaken for one another if scaled/measured similarly.
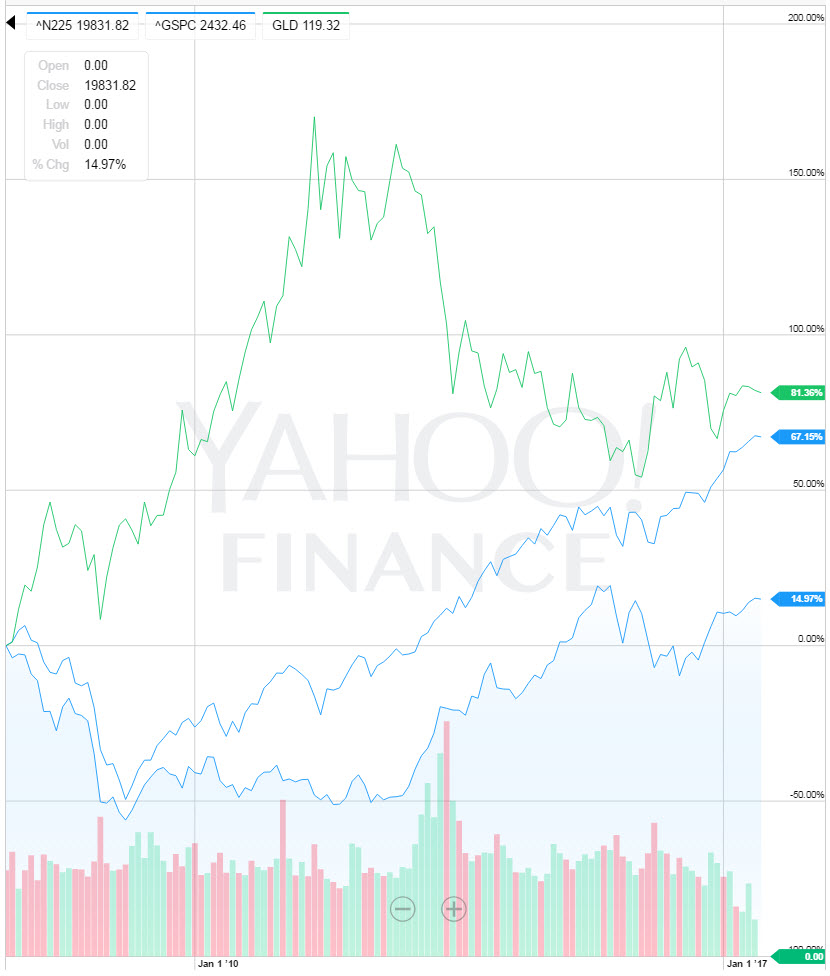
Next, I benchmarked these indexes and GLD at zero % (poor surrogate for Gold but it’s what I had to work with at yahoo – I know…I’m not that sophisticated).
Primary area section and volume indicators is for the Nikkei (bottom).
….and here is my marked up version highlighting the diverging, converging and periods of stock movement parity relative to GLD.
Note the HUGE volume spike in 2012 Nikkei volume which killed PM’s (massive central bank buying?). To my eye, this is further evidence of the relationship and effect on Gold price.
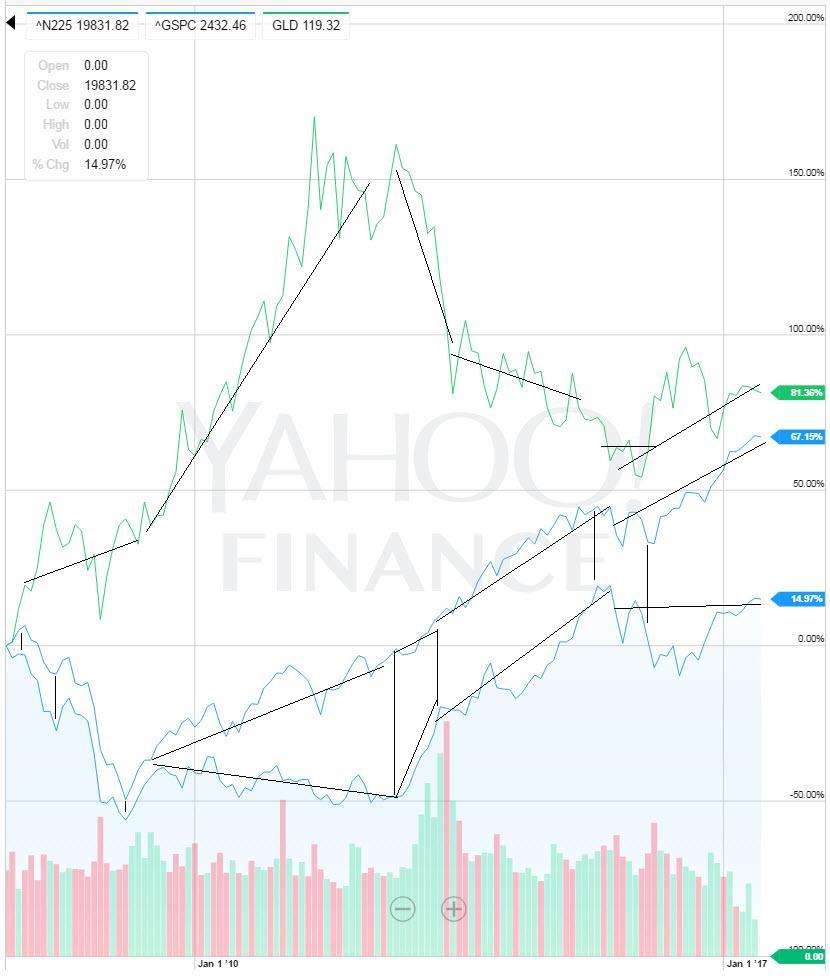
I’d say based on these charts, that one’s view on where the price of gold is going should depend on the outlook for converging, diverging or neutral forecast between the S&P 500 and the Nikkei. Right now it looks like we have DIVERGENCE (18 months). Note the SEVERE DECLINE in Nikkei volume.
Three scenarios if this theory holds:
THE WORST case for GOLD’s future – The Nikkei outperforms the S&P (in any direction!). What are the odds of that given each country’s debt/GDP ratio (US is still king of the debt serfs).
THE CONCERNED case for GOLD’s future – the two stock markets resume movement in tandem (neutral spread) from this day forward.
This is where my tinfoil hat tells me that the successful (yet unsustainable) FED+BOJ FX and direct/indirect asset purchase support of the Japanese stock market in relation to the S&P, is the tool of choice to ‘manage’ the price of GOLD. FULLY – I know you don’t like GOLD price manipulation theories so please poke holes in this idea (I’m doubtful too but this is where this idea is leading me).
THE BEST case for GOLD – continued DIVERGENCE in markets – either S&P stays on meteoric course and Nikkei languishes or S&P goes flat or falls and Nikkei falls further (note declining volume!). Again, I don’t see USD’s in a flight to safety to the YEN (except by coordinated Govt’s & CB FX movement) nor US Stocks being sold in preference for those in the Nikkei.
Bottom line if this idea has credence – CENTRAL BANKERS BETTER SUPPORT THE NIKKEI relative to the S&P or their whole FIAT WORLD GOES TO HELL !
BTW since we know the Bitcoin (or any crypto)-to-YEN ratio is going through the roof, it’s seems logical that when the CC’s collapse, correct significantly, or govt’s go after them (income/cap gains Value Added tax etc.) there could be a HUGE rush back into cash-YEN (supportive of GOLD).
I know this isn’t TA per-se but I especially hope to hear from Graddhy, Fully, Spock, Norvast, Plunger and other experts as to whether this analysis is sound and if so WHY this apparent tug-of-war between equity markets would have such an effect on the price of gold (esp. if different than what my tinfoil hat is telling me).
Please also comment on where you think the S&P/Nikkei spread is headed?
Thank you.
PS. Further analysis I’d like to do is to compare these chart timelines with Fed and BOJ CB monetary policy decisions – it could be that there is at least circumstantial evidence of coordination especially around points at which markets change their divergence/convergence trajectories as in 2011, 2012, 2015 & 2016.
Interesting analysis. Thanks. Establishing these links and relationships between currency pairs and PM price movements can be helpful and instructive. Past behaviours are often echoed, but the move away from cash and into digital and crypto currencies may well disrupt things somewhat. It’s all about supply and demand of course, with huge moves likely to develop if/when the crowd stampede for the exits in crypto or stocks. PMs will just sit there, all shiny, just as they have done for millennia.
Wow YYZ
This will take some time to digest
I just skimmed through. Off to work today.
This deserves some thought. Will do this evening.
So in summary If the SPX Outperforms the Nikkkei ….the Yen appreciates and Gold benefits ?
Interesting inter mkt relationships.
But SPX Nikkei yen and gold all seem to be endogenous.
What are the drivers behind these supposed results?
I have to suspect relative monetary policy. Which CB is racing fastest toward casting its fiat into oblivion. That sort of thing.
Right now, believe it or not, the Fed — as GHWB would say — is almost being prudent.
[cue Dana Carvey for that clip]
The SPX does not necessarily have to outperform the Nikkei, it just has to diverge from what ever trend the Nikkei is taking to be bullish gold. Basically Gold spot appears to be a function of the changing (growing or shrinking) spread between the US and Japanese equity markets.
Spread growing = bullish gold
Spread stable = bearish gold
Spread shrinking = GTFO (a la 2011-2012)
What I’d like to do next is see how the recent 11 year relationship compares historically going back to the 60’s and esp. 70’s (when Japanese manufacturing was going to take over the world).
One thing I did notice is that from Q1 2016 to Q3 2016 the Nikkei and gold were nearly INVERSE (gold on a tear), but so far this year, they have moved parallel (anxiety about gold). Because of the recent volume fall off in the Nikkei’s rise, barring any market ‘interventions’ like the 2012 volume spike, that market is at risk of falling and surely at risk of NOT KEEPING UP with the SPX’s rise. On the other hand, my guess is if Nightingale’s US mkt top call is correct, Gold will only be bullish if the Nikkei declines faster than the SPX (which again, barring ‘intervention’ I think it should).
Thanks YYZ. Its a lot to take in and interesting at that.