Possible bullish action in gold but $1145 still could be in play in my view:
In my last gold analysis post, I proposed bullish and bearish near term targets for gold:
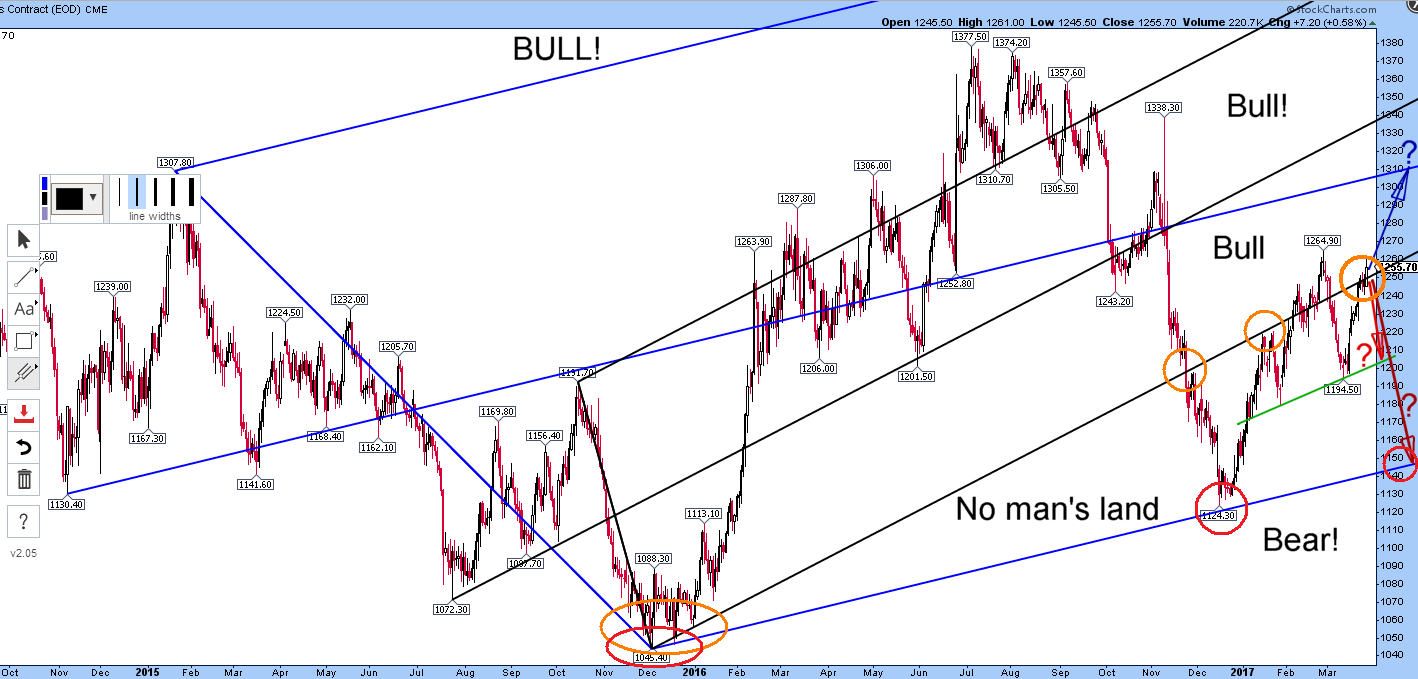
Bearish potential target: $1145 at bottom line of blue pitchfork…
Bullish potential target: $1250 to resistance at bottom line of black pitchfork…
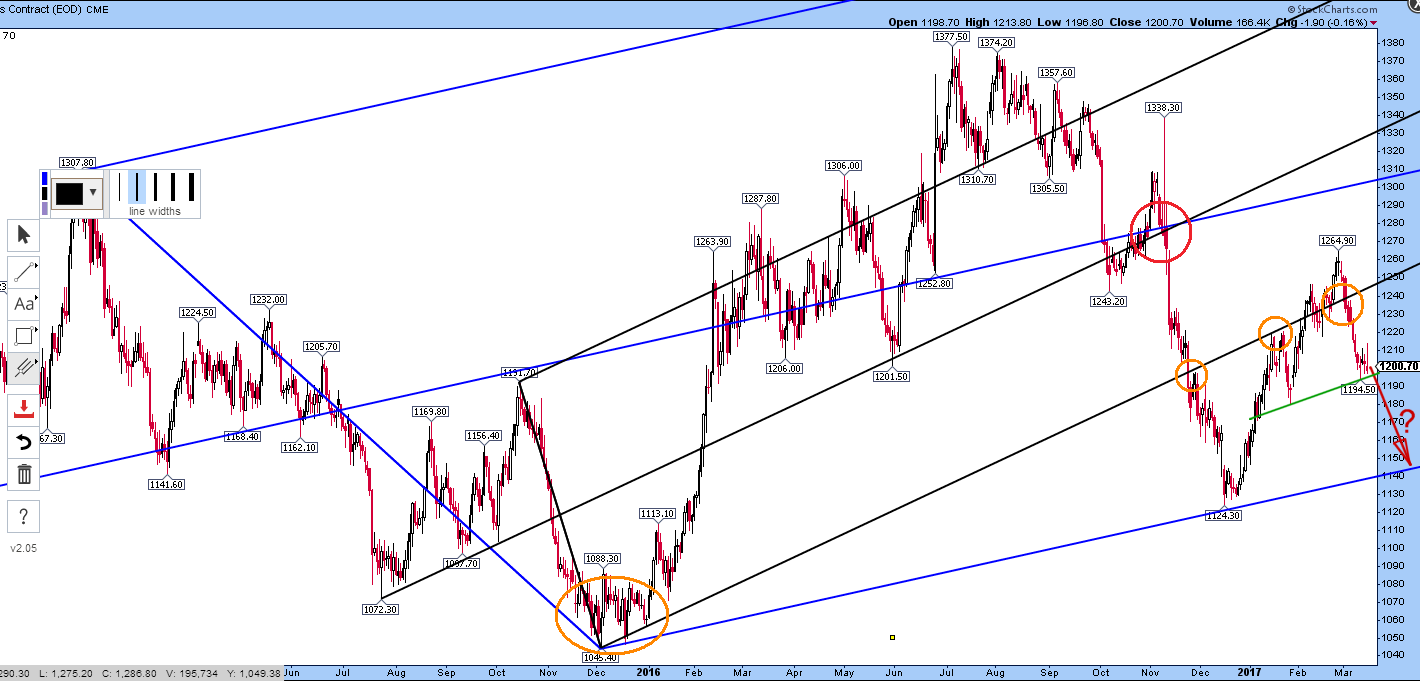
based on this chart from mid-March:
Gold has moved up and has therefore made a kind of head and shoulders pattern with the shoulders both at the lower line of the black pitchfork trading structure.
So the bearish target of $1145 is still in play (using the original chart), despite the bullish move over the past week or so:
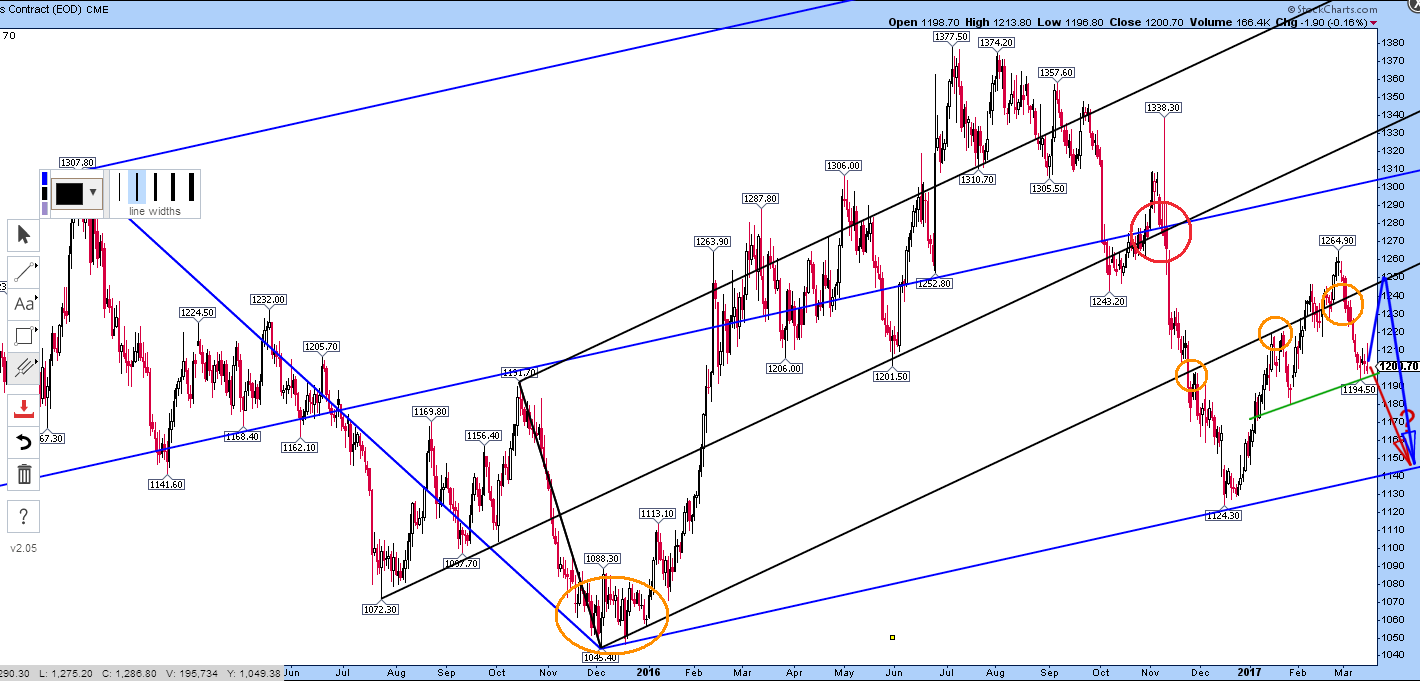
In my view (updated chart), a strong move over $1250-1260 to get the price action clearly into the black fork is needed to be bullish at all.
This is what it looks like today:
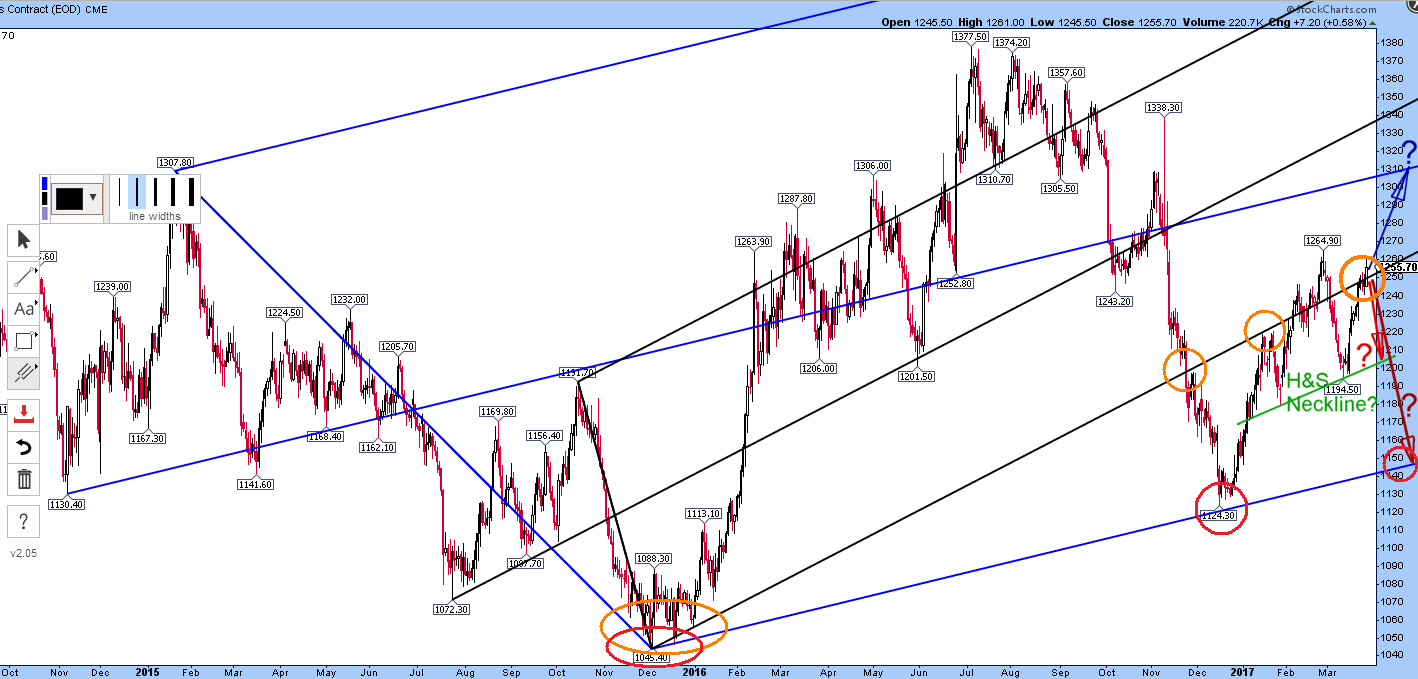
Current price action is in no man’s land in my view: