HUI – Saying What I see
So here’s the thing – I’m looking at these indicators (on a weekly setting rather than daily), and thinking it all looks pretty promising to me. Here’s the chart/indicators…
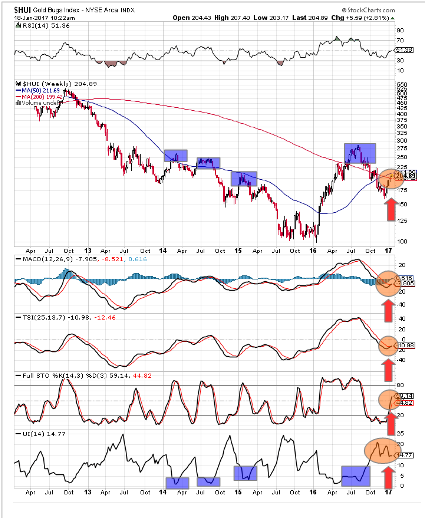
The MACD and TSI are crossing over and pointing upwards. Pretty bullish. Full STO recently started rising from its low point, and has room to rise further. Bullish. I’ve looked back to see how the UI seems to work (in bull and bear markets). Long story short, if it’s risen above about 15, then starts to fall, the HUI doesn’t stop rising until the UI drops to (approx) 5 or even less – it’s currently on about 14, so has a good way to go yet. If these indicators are anything to go by, we have further to go on this leg up. Having said all of that there is always the exception that proves the rule 😉
On the weekly chart, when I set UI on 5, it looks more telling of caution. It is at 0. In the last 4 years, July of last year was the only time that it stayed at 0 longer than it has this time. The two hr chart has had 5 push ups and is showing weakness. Looks like at least going to fill the recent gap.