GDXJ – Hope Floats
A different view of GDXJ. Green arrows for the two shoulders, red for the head, blue for the backtest. also notice that price is just below the 200 day line, covered over by the green trendline. RSI is much closer to a top, as is MACD. Volume on the last uptick was considerably less than previous. Everything screams: Watch Out Below!
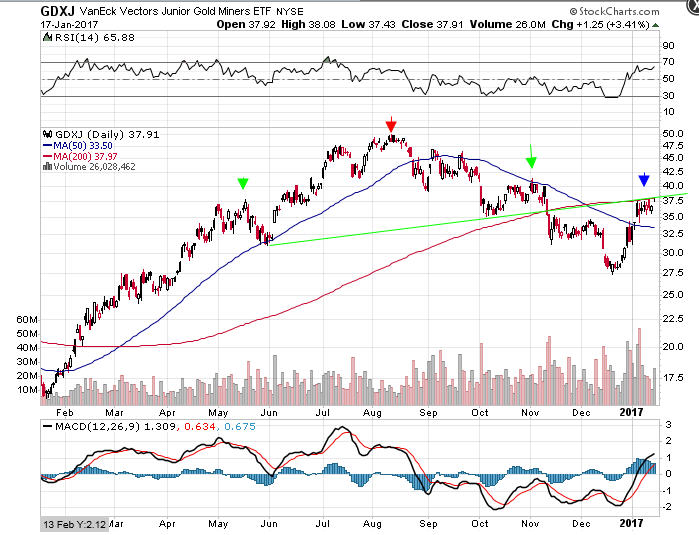
RSI means very little, you look at most bull markets the RSI stays high and flat for far longer than anyone can stay solvent shorting it near a top.