How does the 20 month moving average gold chart look today?
This is a polite request to Fully to post his 20 month exponential moving average gold chart if he hasn’t in the past week or so, ’cause I haven’t got the charting stuff to do one.
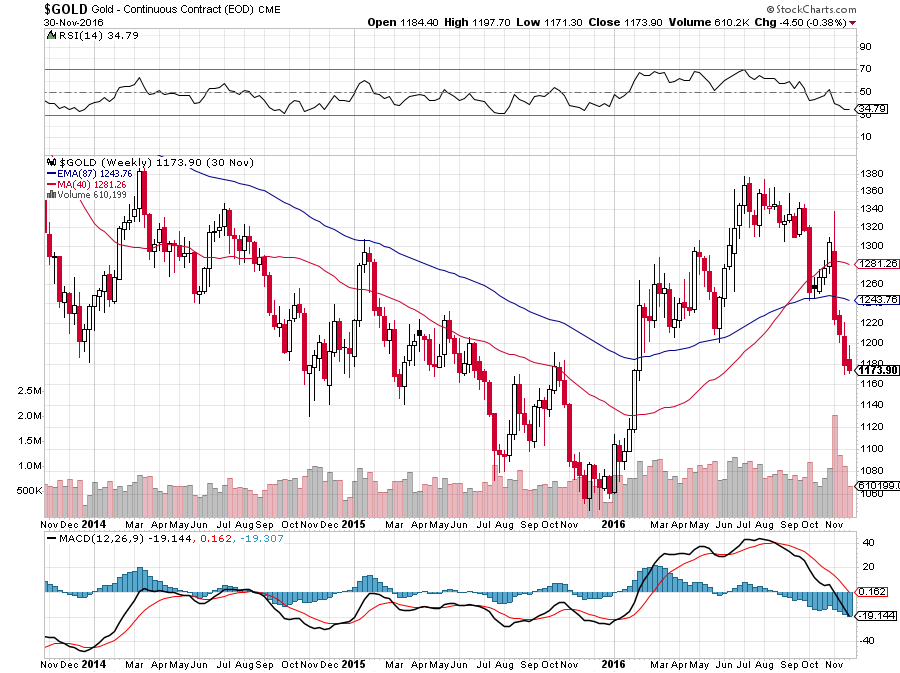
I have done an 87 week ema which should or might be the same. It looks awful (blue line). This support is decisively broken by $70. The red line is the 40 wma (200 trading days) and I notice the price did a nice little end run around this line before the failure:
By comparison, Fully’s chart showed that in the 2008 metals crash, the 20m ema was broken by about $120 ($681 price vs $800 20m ema). I think $70 is in the same ball park, especially since there is no massive deleveraging credit crunch and stock market panic crash going on at the moment. For this to be a false signal would there not have to be some massive exogenous event to create a false signal, such as happened in 2008? Bulls are going to have to come up with a real good excuse.
Furthermore, I don’t think this is able to be shrugged off as a strong dollar phenomenon. The action in gold in Sterling (not exactly a strong currency) looks even worse, since the pound has actually pushed slowly up against the USD in recent days and is now $1.25.
Last version of Fully’s 20m ema chart was 24 November 2016, on the line:
https://goldtadise.com/?p=388185
https://goldtadise.com/wp-content/uploads/2016/11/gold-1-5.png
Fully kindly updated his chart on 1 December 2016 in response to my question:
Fully’s chart from December 1, 2016 – 11:00 am:
https://goldtadise.com/?p=388640