$USD QUARTELY
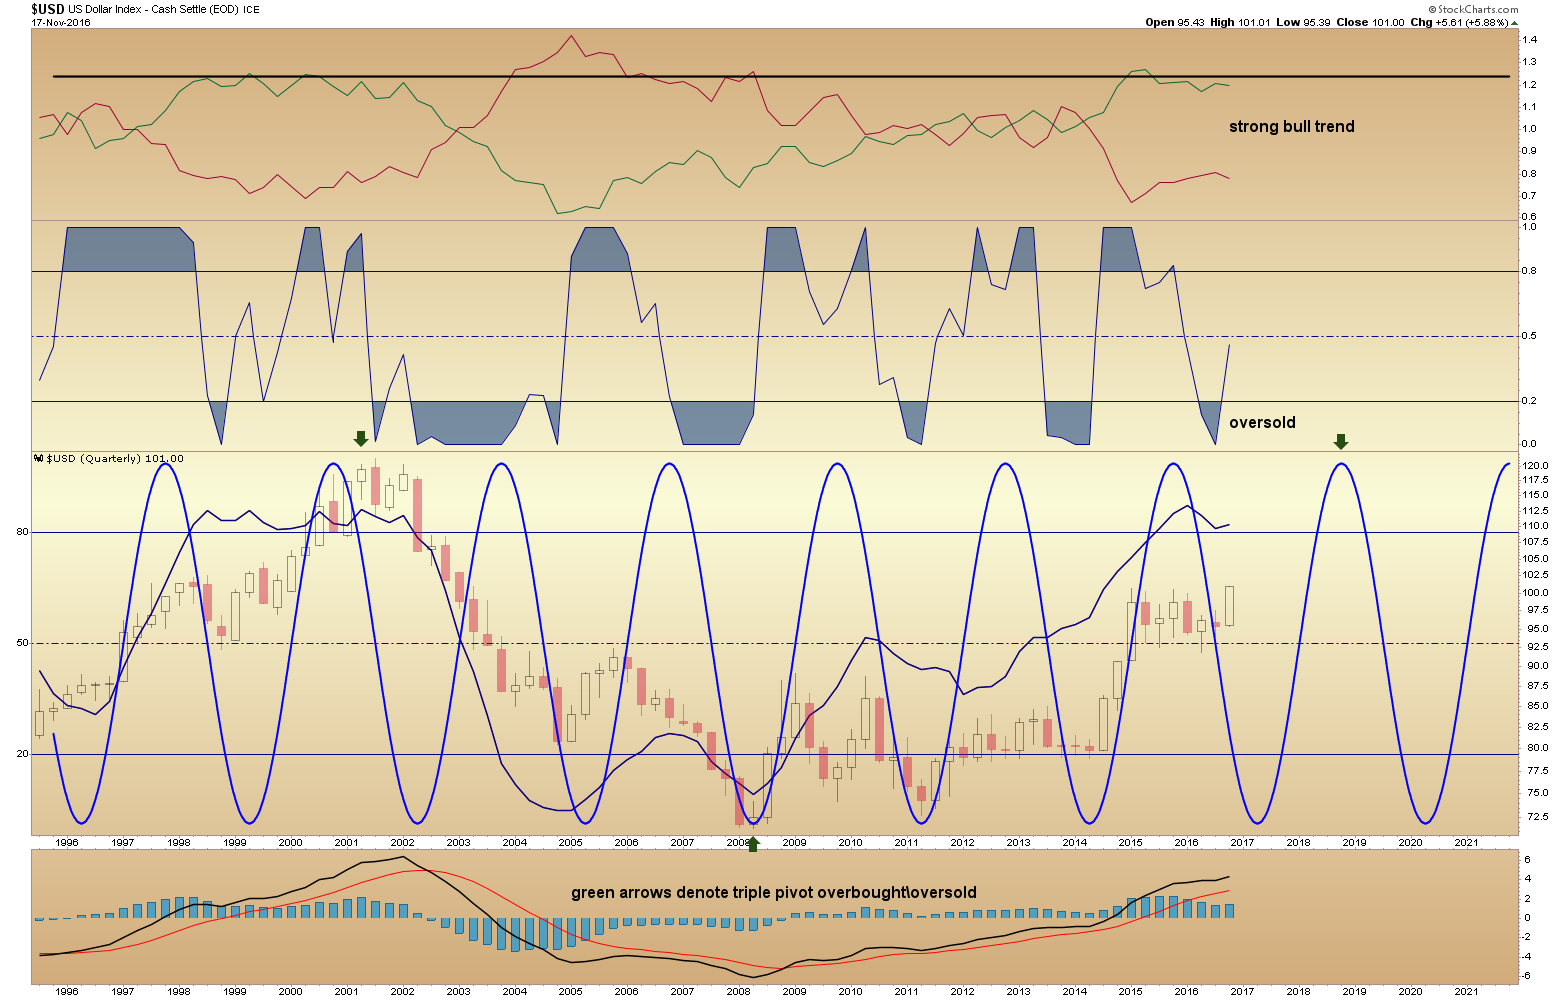
-been showing variations of this chart for many months.. since near the middle of the GDX bull phase probably
-very few (if any) show the quarterly charts on any indices I’ve noticed. I think it’s the most important one to understand the big picture.
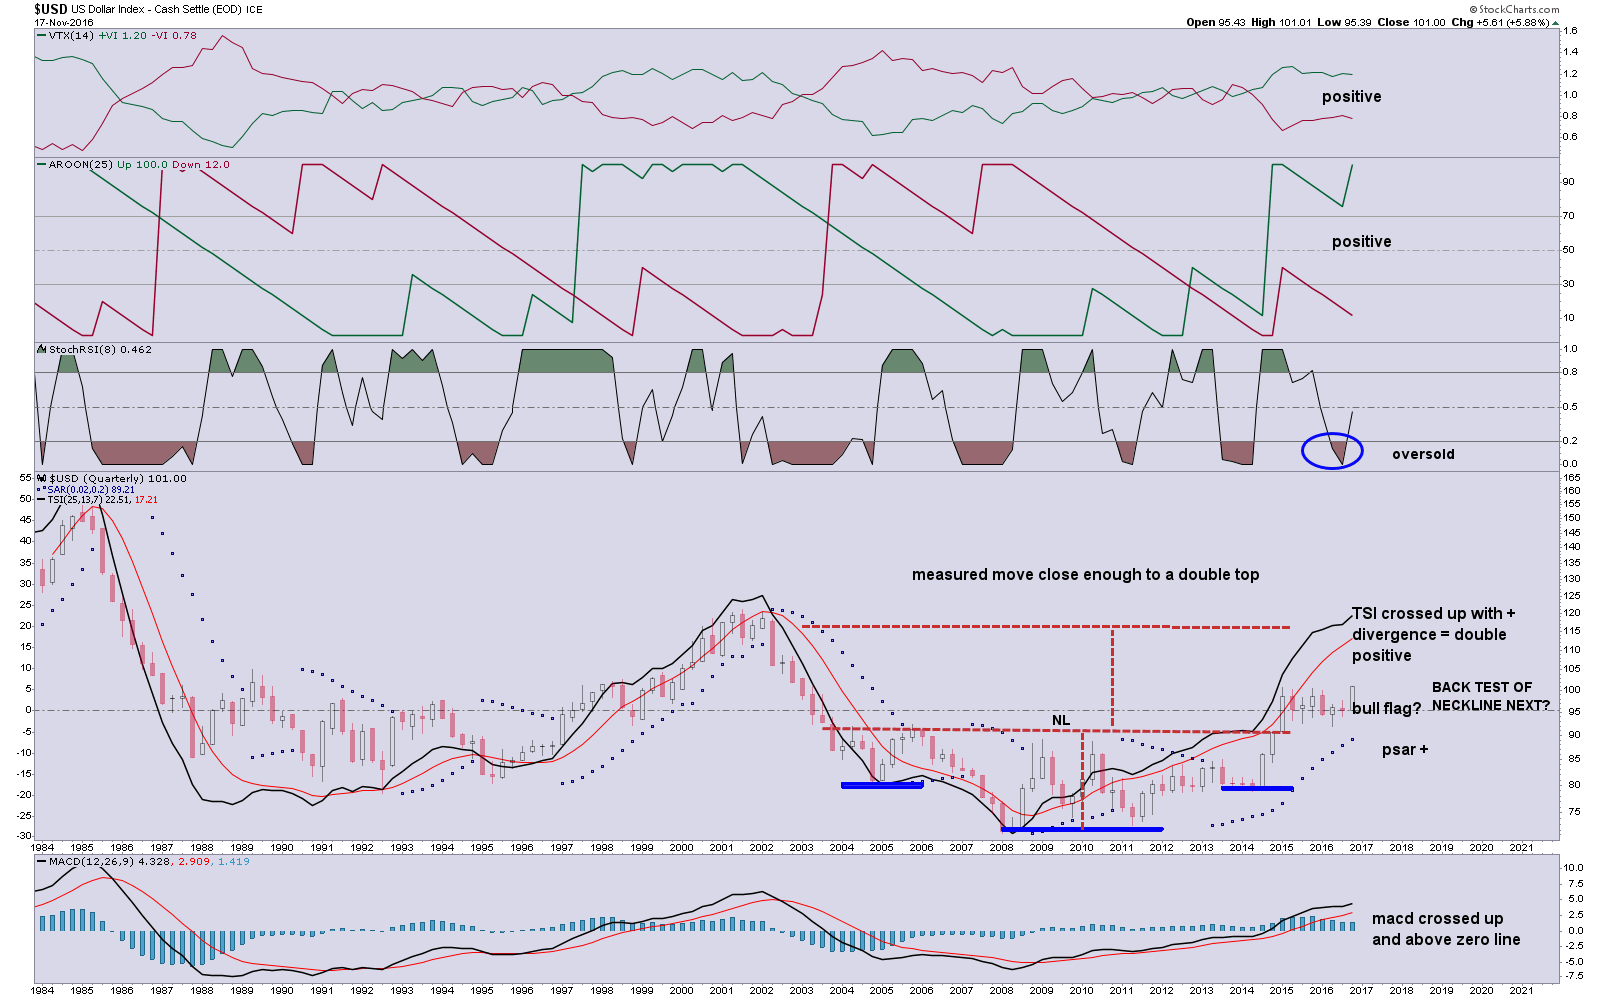
-this inverse head and shoulders measures to 117.5 to 120
-TSI chart looks like a locomotive..

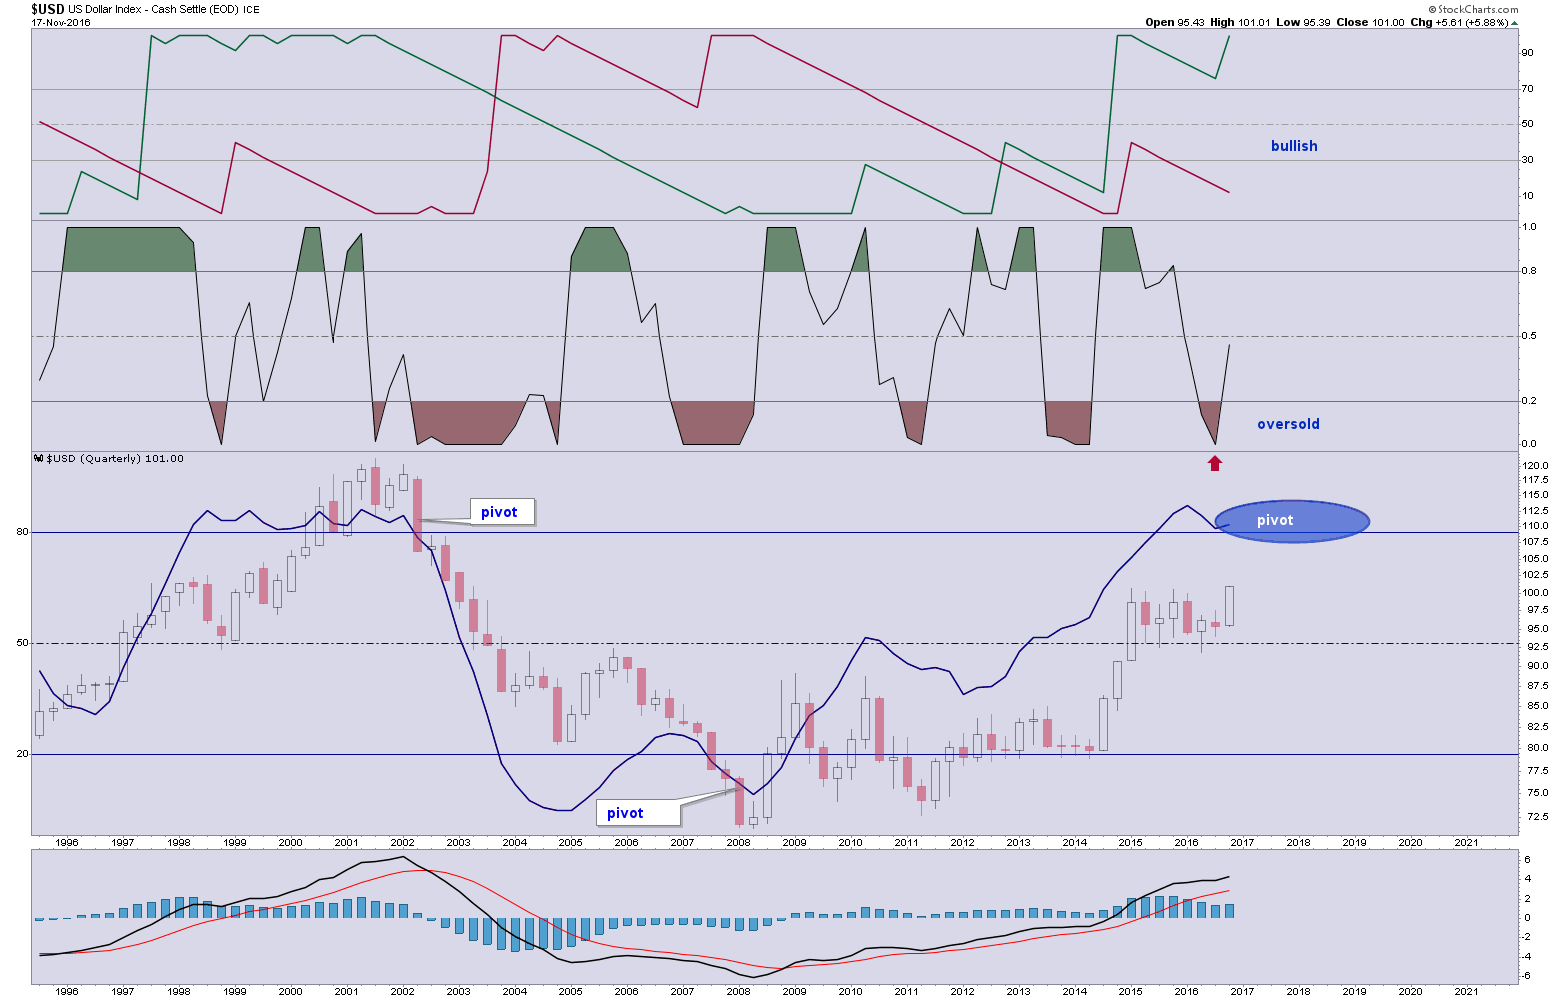
9 year long positive cycle on the MACD is the only thing that concerns me, but i don’t have experience with quarterly charts. Other than that, its looking good.