NUGT 60 1,2,3 Update…Approaching the “thin zone”…
Close to or have finished step “2”…
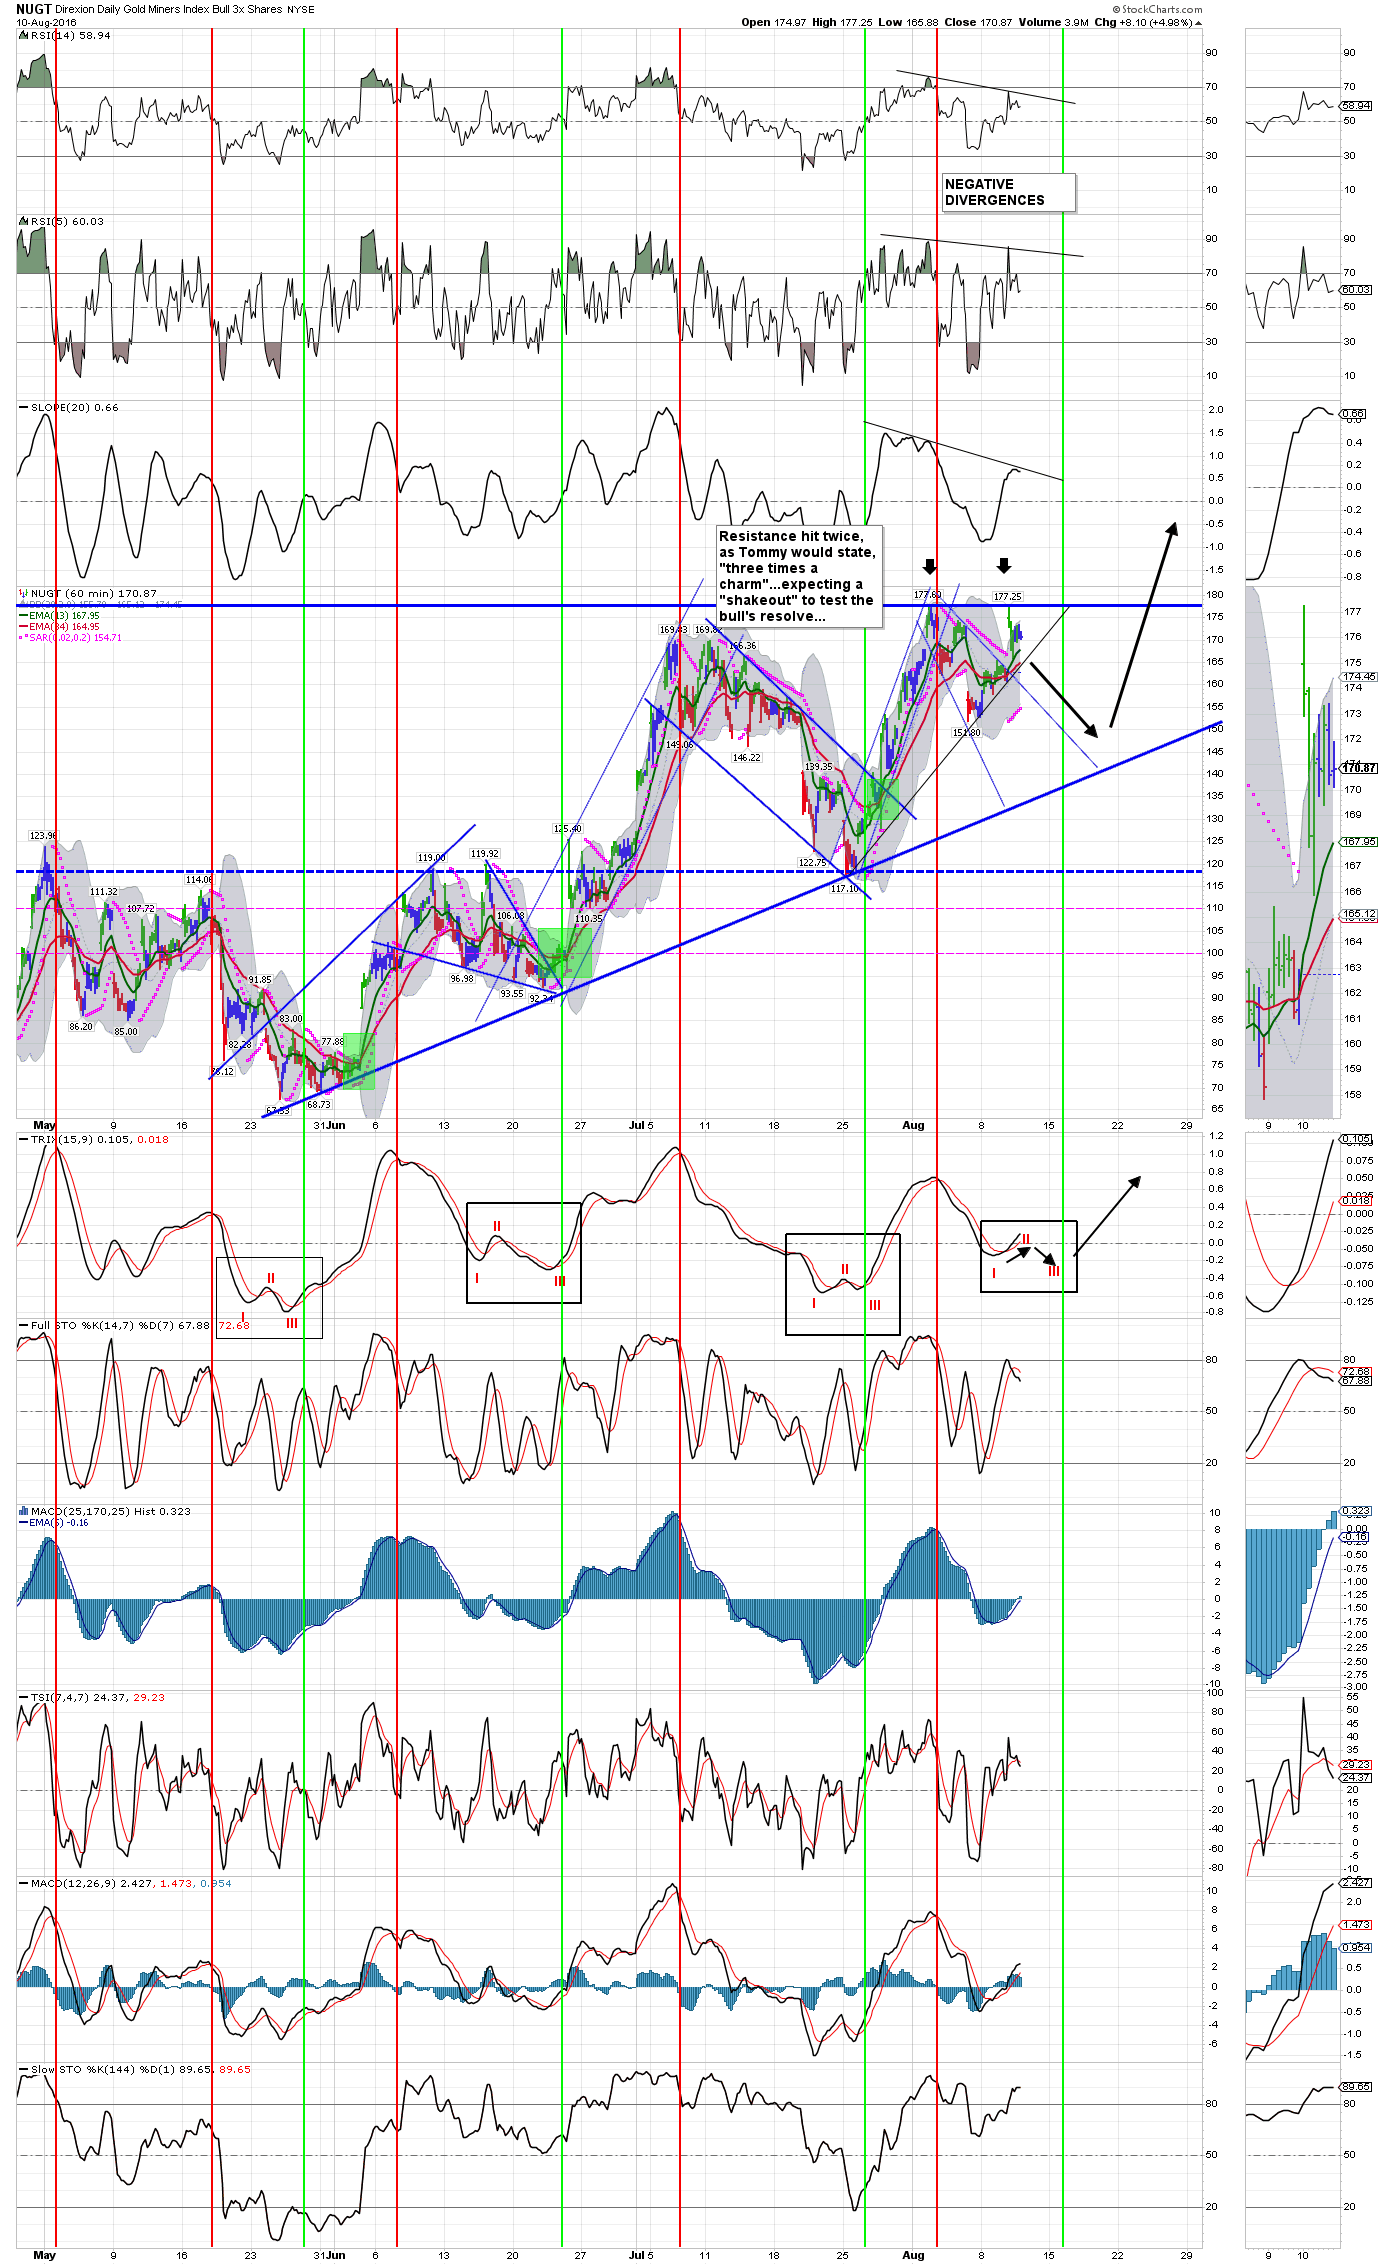

And remember,
Stay objective…
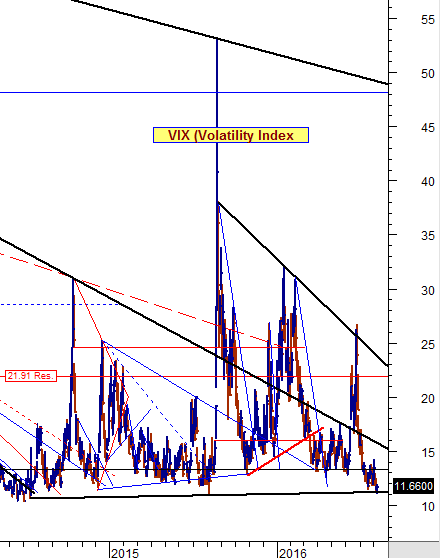
VIX Update
By: Marty Chenard | Wed, Aug 10, 2016 Share
Print Email
The chart below is from yesterday’s close and it show’s the VIX (Volatility Index) back to early 2014.
If you look at the chart, the VIX has a long term support line that it is finally testing.
Remember … that a higher VIX equals a lower market since they are inverse to each other. Therein comes the risk for you, so please keep an eye on the VIX.
Careful quoting me Eagle…Fully would frown on it 🙂
NUGT WEEKLY looks good to go still…
https://stockcharts.com/h-sc/ui?s=NUGT&p=W&b=9&g=5&id=p21092215864&a=471874482&r=1470864826860&cmd=print
traders had some fun between the lines today on UVXY..
https://stockcharts.com/h-sc/ui?s=UVXY&p=15&b=9&g=5&id=p46759109900&a=471876397&r=1470865385439&cmd=print
Thanks Tommy, appreciate you and your charts. Good luck!