Gold price at centre line of a key pitchfork. All to play for!
The gold price is at the at median line of a key medium term pitchfork that I have been watching for a while, that is actually parallel to a much larger long term structure coming from early 2011. The recent pitchfork is this one:
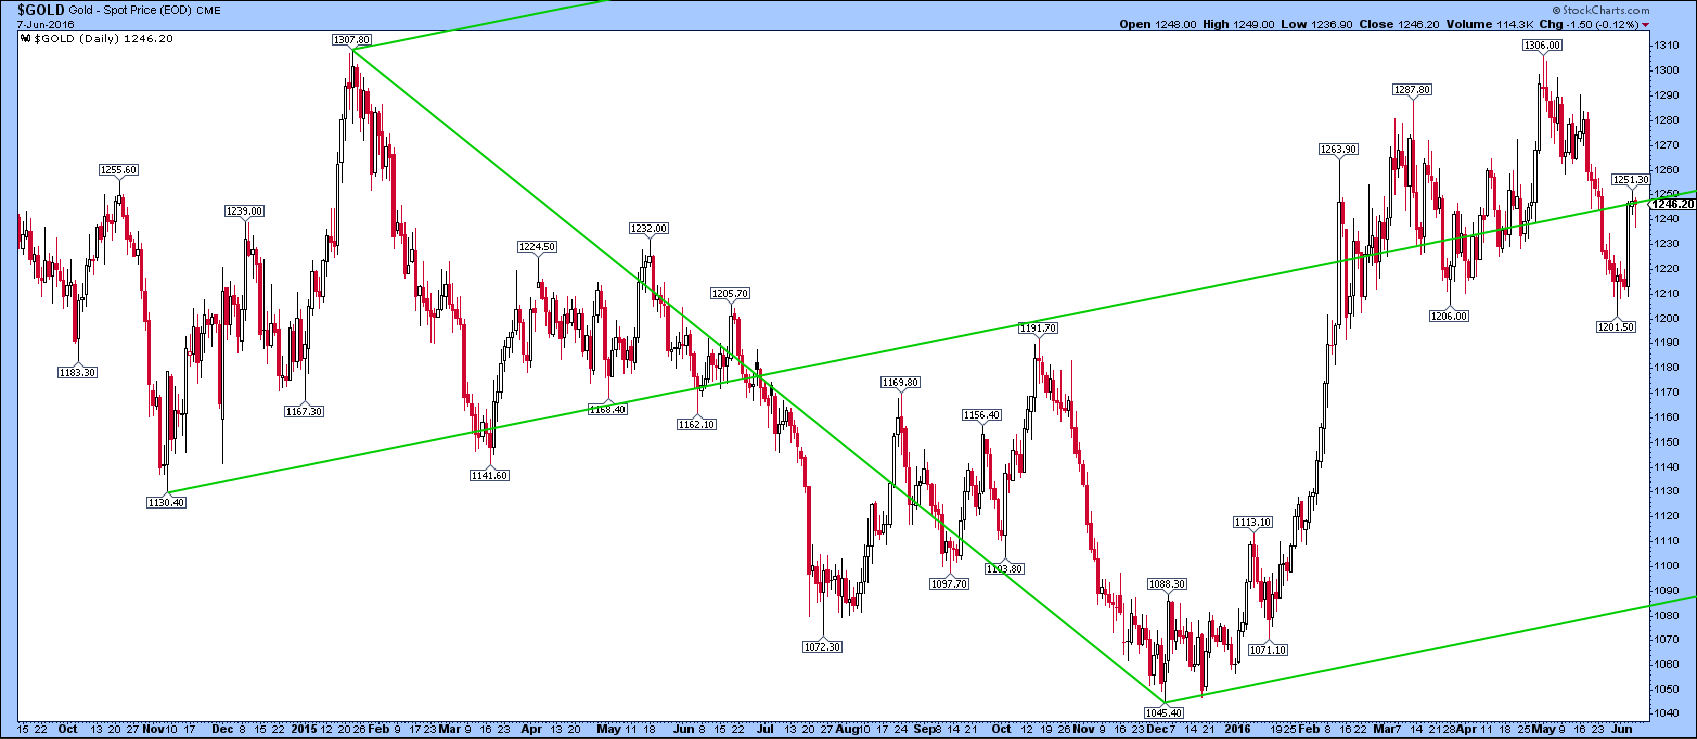
There is a steeper Andrews pitchfork drawn from a later low at $1072.30 which might also be in play but this slightly larger one seems to have the relevant slope. If so, then $1251 is resistance and a move above it would probably be pretty bullish. This $1251 price was an important low on the way down in 2013 too.
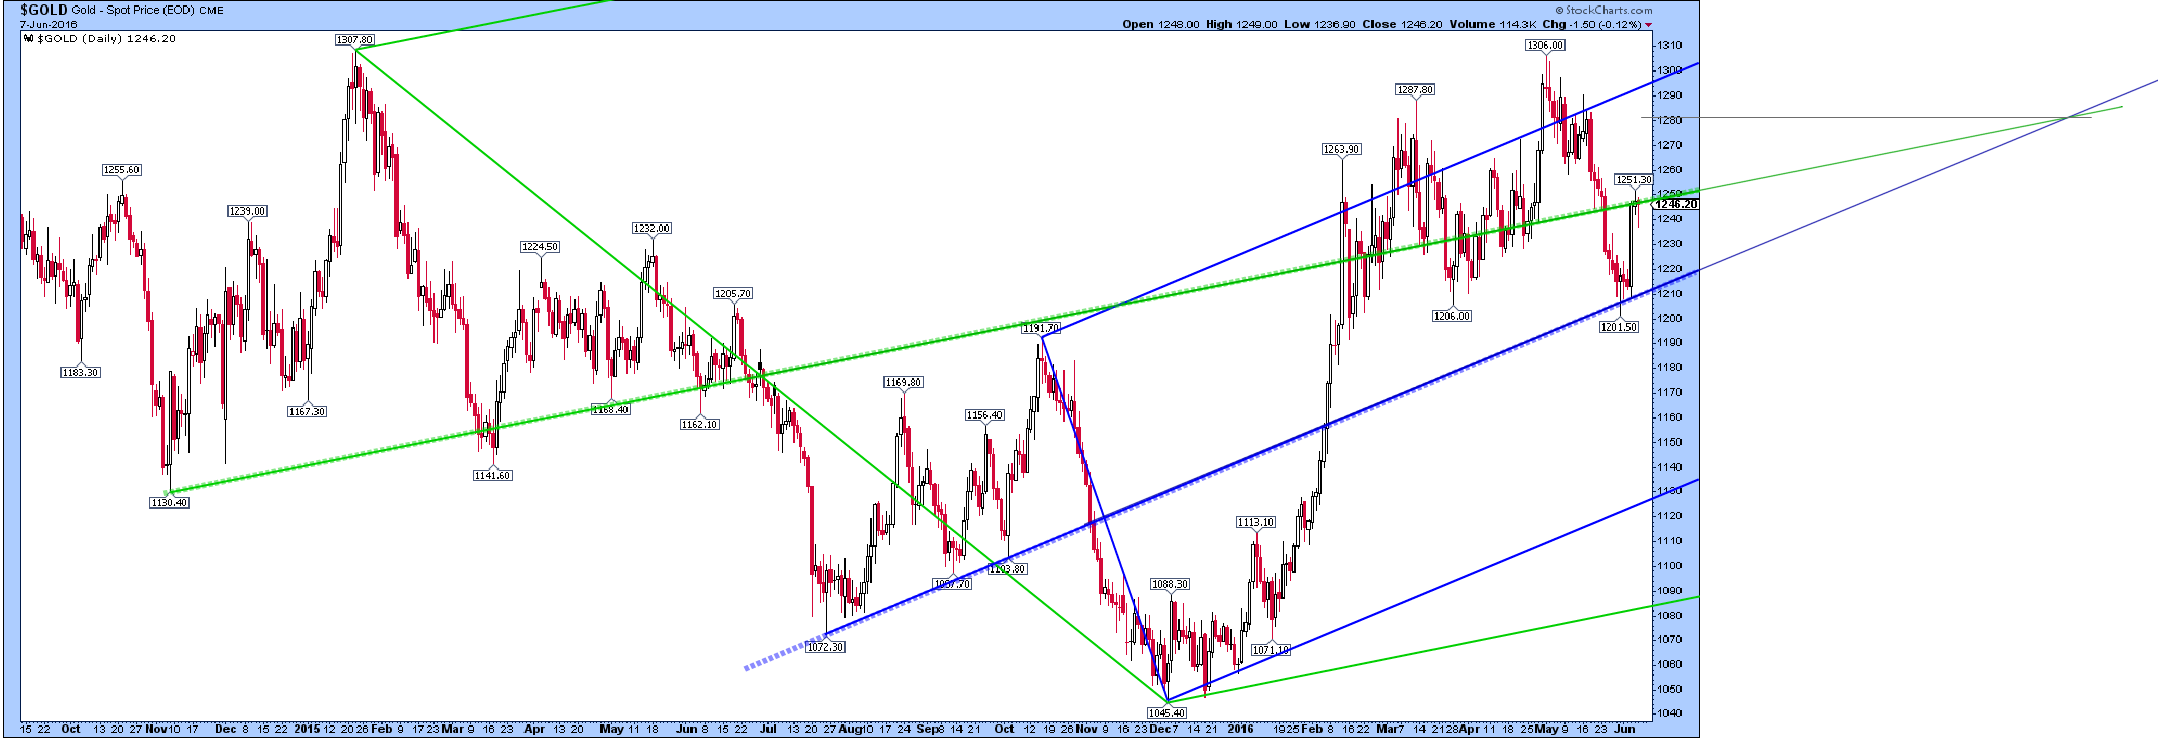
The short term pitchfork is the blue one and defines the slope of the initial move better I think. The major Jan-Feb 2016 swing higher accelerated through the median line symmetrically. Price flushed slightly below the median line when it dipped to $1202 last week. Both these slopes seem to be operating here: both are bullish I would say. They converge on $1280. There is plenty of prior trading on both of the dotted median lines:
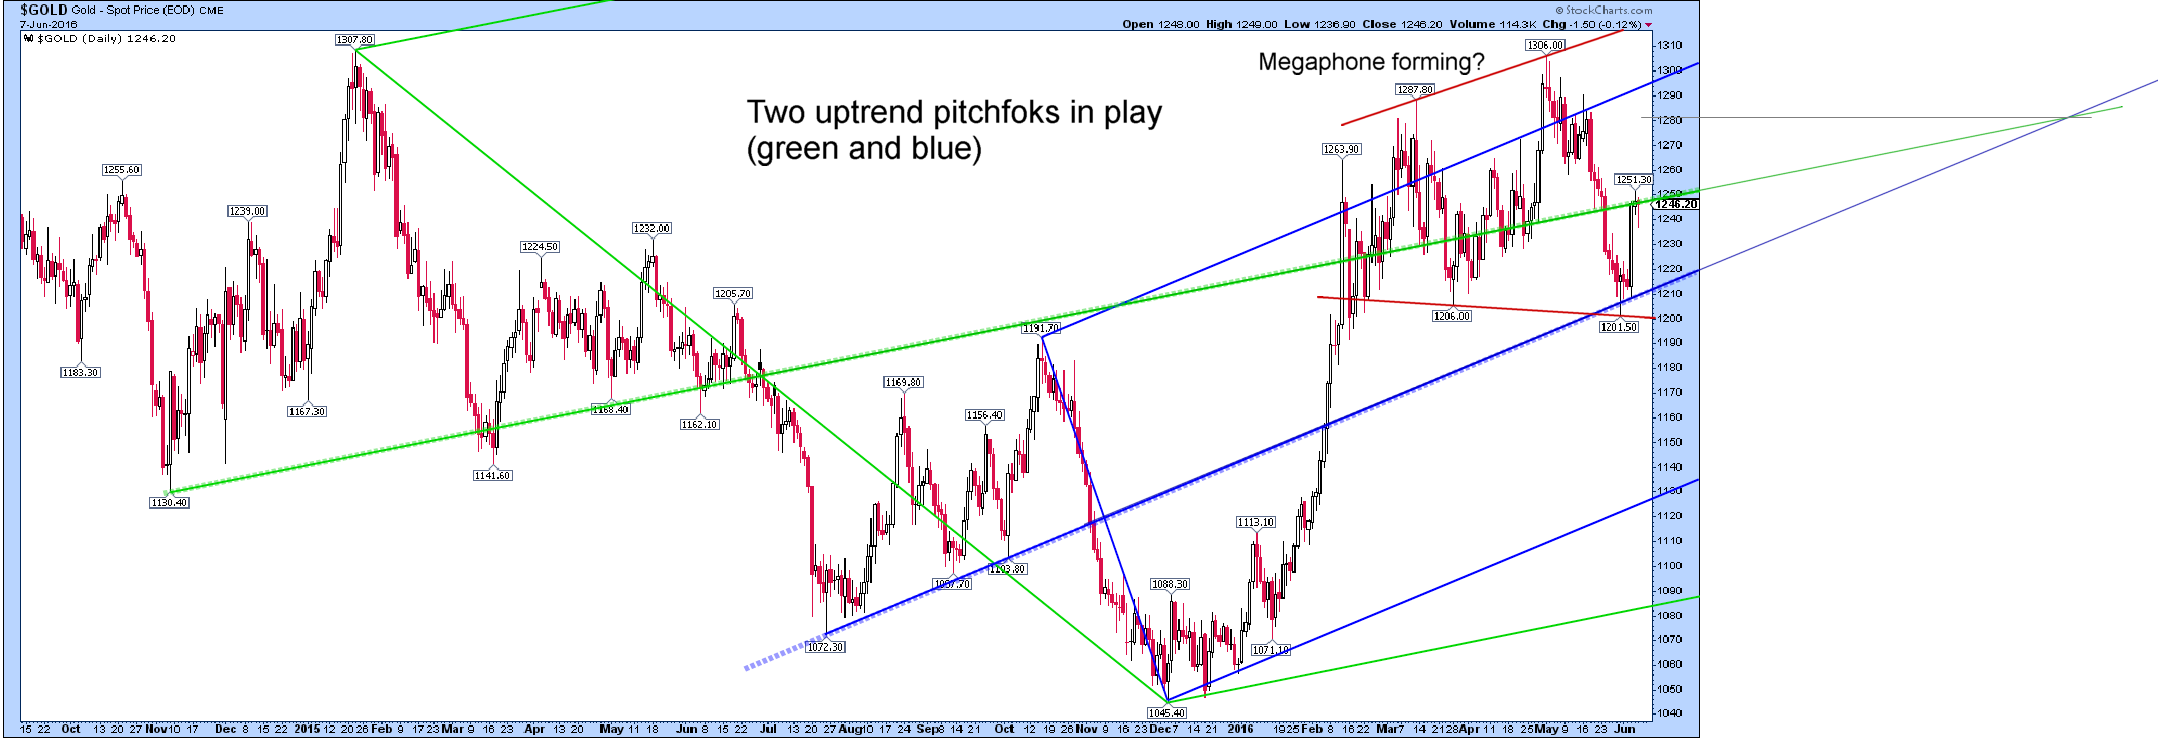
However, the recent action since March is looking a bit like a megaphone expanding top, which might not be so bullish! The bull flag seems to be out of the picture but I am not sure that really matters. I mean, even if gold goes down to the bottom line at $1090, maybe that would be the gentleman’s entry point! The megaphone formation would point to a move down to that lower green line at $1080 or even further perhaps to $1050 again but first requires a move above the ‘Matterhorn’ at $1309 for the third high of the megaphone. So, for bulls and bears there is still lots to play for but at the very worst it looks like the gold market itself is in the process of turning long term bullish:
Looks like we are going to cross the median line today. Thanks for the cool charts.