Using DGLD to Predict Gold Swing Points
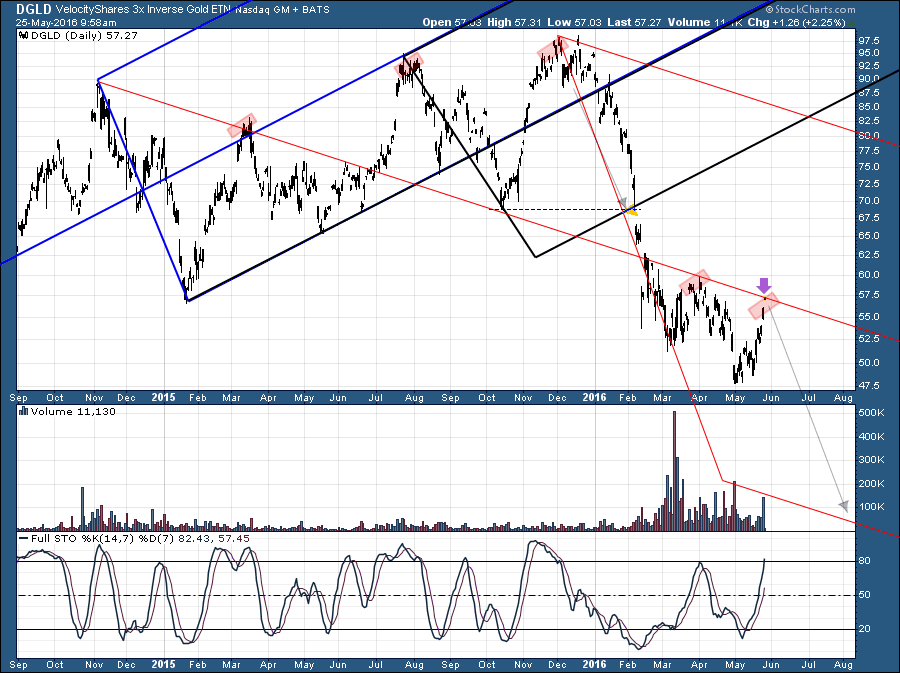
Back in early Dec, this was one of my main charts I considered when predicting that gold would move from $1080 to over $1200. I obviously underestimated the move but the chart structure still worked. I have updated it with an additional fork extension and I believe it is telling us that the gold pullback is nearly complete. It could still drop a little bit and maintain the chart integrity. What you will notice is how these reversals never turn on a dime and typically take a week or more of frustrating churn before the swing low or high is in place. I know it’s odd using an inverse ETF to look at gold’s movements but so far it’s been working well for me.

10am Update – DGLD just tagged my resistance line. Let’s see if that’s it for gold’s correction.
I find the opposite ETF VERY helpful…I.E.DUST 60…
Mark, Nice work!
Wait, wait, wait, according to Gary at SMT, the bloodbath phase for Gold is just ahead.
http://blog.smartmoneytrackerpremium.com/2016/05/baby-bull-done-next-phase-gold-bull-begun.html
Gary is most likely going to be completely wrong and will miss out on this uptrend just getting started. He will never see HUI at 175 as he guaranteed would occur in April. These tags back to 50MAs and key fib levels are NORMAL in a healthy uptrend! I will post some example charts shortly.