COT comment and unrelated Article on marketslant: Has the Fed Lost the Plot and Ignited the Perfect Storm for Gold?
Hi All,
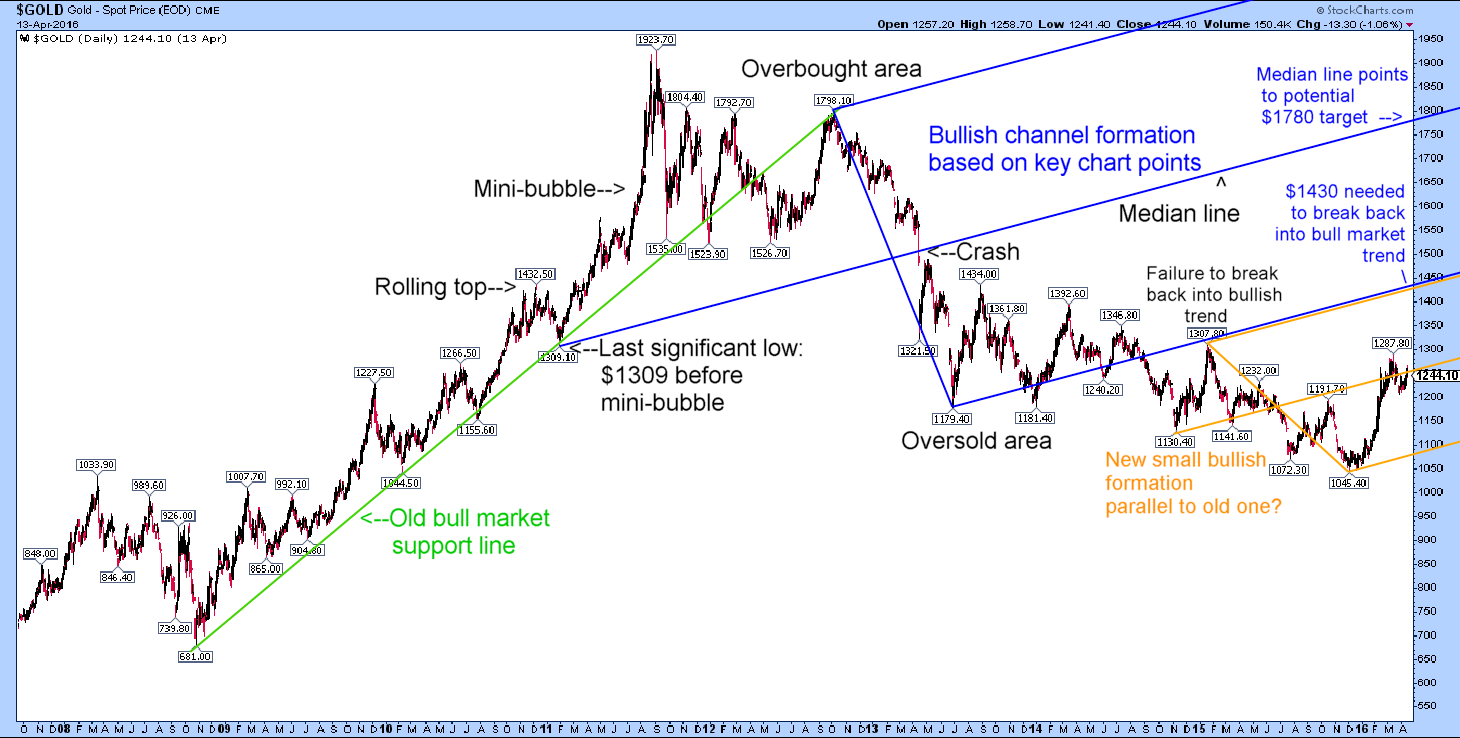
I wrote an article on www.marketslant.com that includes a bullish type of long term chart:
http://www.marketslant.com/articles/has-fed-lost-plot-and-ignited-perfect-storm-gold
The chart from the posting is here:
Please like the article, well, if you like it at all! I don’t know if the Fed is igniting the perfect storm for gold; it doesn’t seem that they are doing it this week, that’s for sure. Related to that, I was looking at whether commodities were outperforming general stocks yet – but it seems that they aren’t, although gold has been doing just that in 2016.
So, it’s an open question, related to the inflation/deflation debate I suppose. Silver and oil’s recent rallies have implied a more inflationary bias – but will it continue?
COTS: I like the current discussion of the COT figures, by the way. They seem to get interpreted in different ways on the internet that sometimes seem to contradict. It would be great to get a really clear idea of how they work if at all in a baby bull market and even whether this is actually a baby bull we are having right now!
I just have a recollection that the COTs in mid-2009 were way overstretched as gold tried to re-take $1000 (before it made a new high over $1025) but I can’t remember the exact details. It then went to $1224 before year end. If I recall, India also bought a bunch of gold at around $1045-1050 at that time.