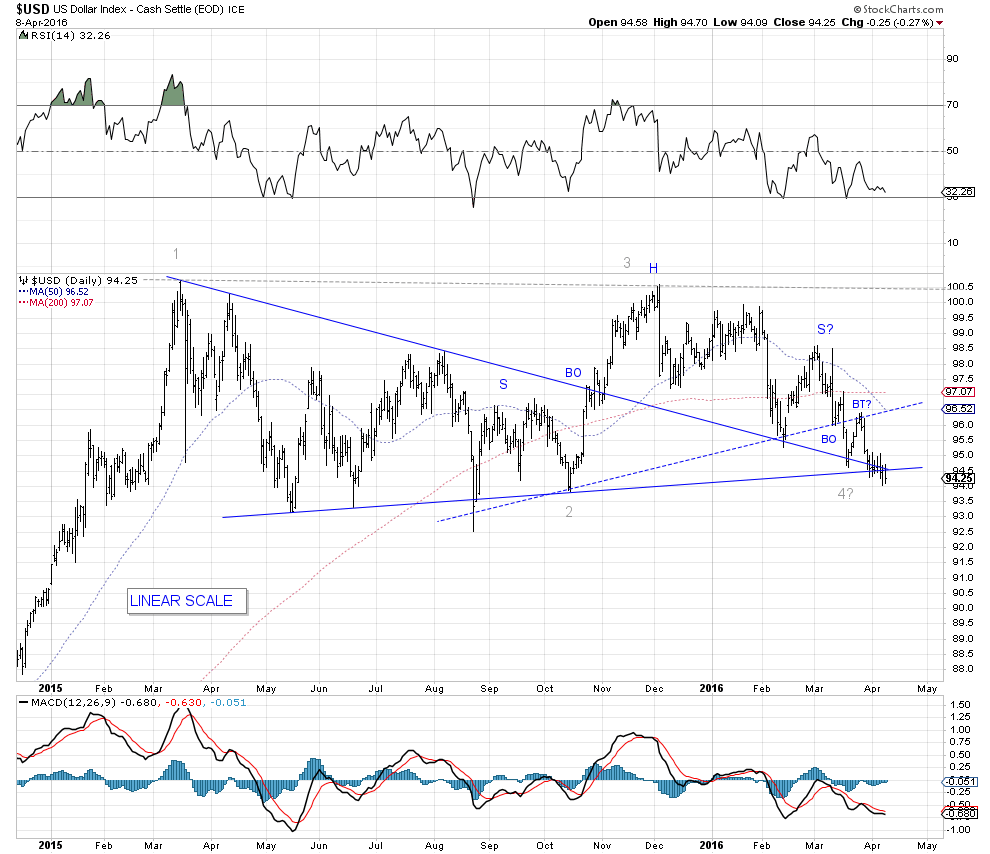
$USD – what next?
The upper blue trend line indicates weakening support for the USD after the breakout confirmed last November. The lower blue trend line indicates increasing support going all the way back to May. The Apex of the triangle is the FOCUS of the battle between the Bulls and the Bears. A break downward at this point could be very bearish for the dollar. However, a sharp rally cannot be completely ruled out.
The USDU, a broader measure of the dollar, shows a breakdown and BT at the apex in March. Note bear cross with 50 and 200 day SMA both charts.
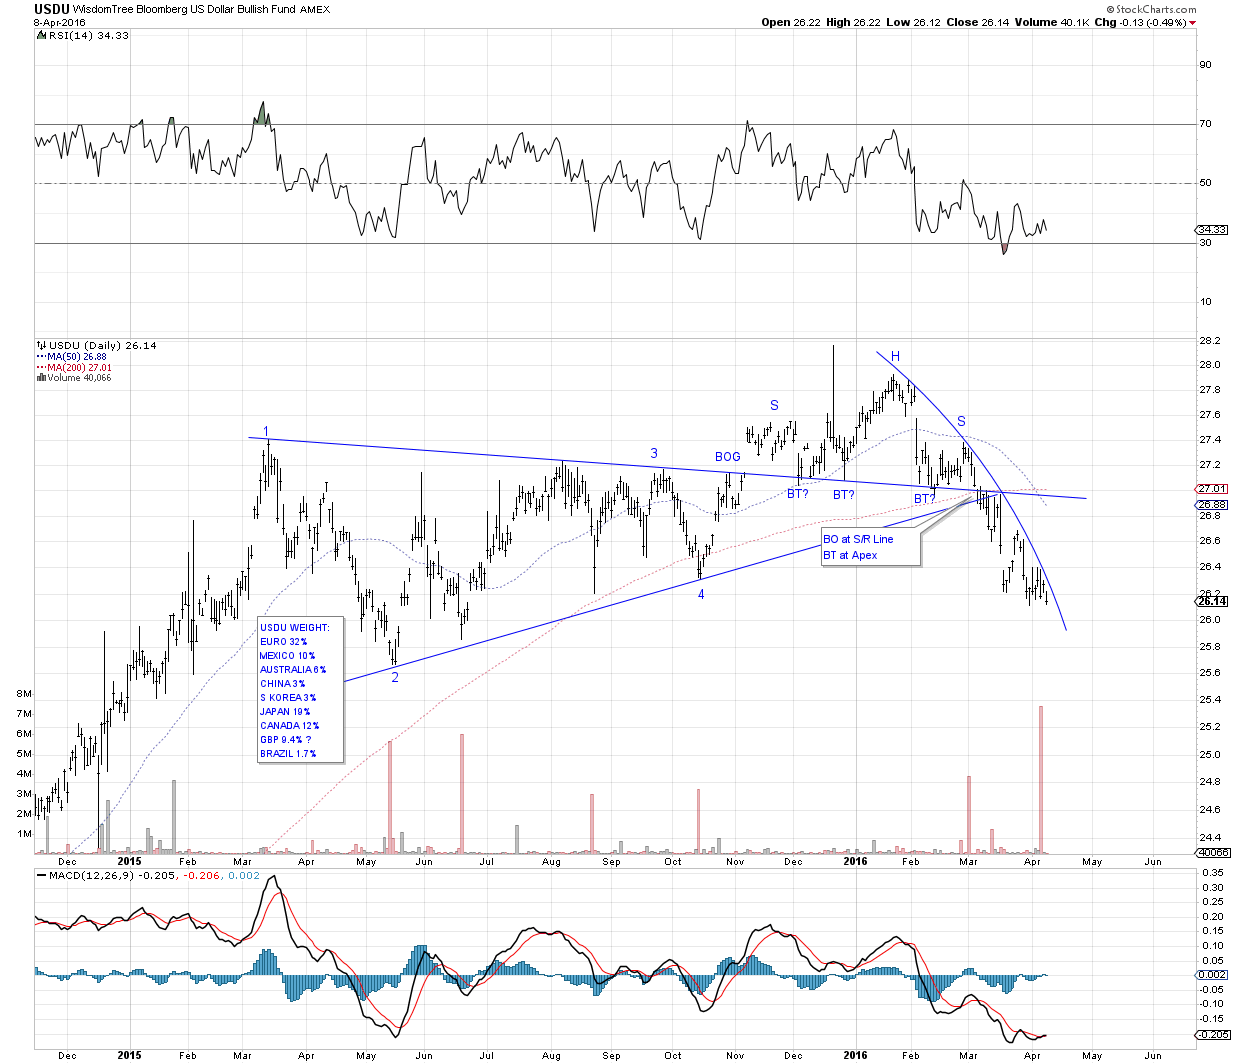
Nice charts. Dollar looks putrid to me. Esp USDU which seems like the one we should really be paying attention to.
Silver Fox, Very Nice work. Your dotted H&S neckline is very similar to my 3 Year USD Cycle uptrend line. Once the USD breaks the 3 Year trend line it almost always signals a top in that cycle. Future rallies may backtest this line but they should not break above it if the 3 year Cycle has topped as I suspect.
Also, the longer 15 Year Cycle in the USD may have topped as well which would mean that Gold is leading the CRB into the next Commodity Bull.
FWIW, here is my post on the USD’s longer cycles:
https://goldtadise.com/?p=365244
Wow
The beat goes on
Crisp Clean Chartology
While it looks putrid, the RSI and MACD seems to suggest there is not much downside left. Am I on target or missing something?
You are not “missing something.” However, a chart can remain overbought or oversold for a long while. This may be the case today with the USD.
So let the markets speak. 🙂
I am expecting a 5-6 month Intermediate Cycle Bottom soon so a bounce is due sometime in the next week or so.
Hard to say how bullish the next IC will be.
notice the two huge volume days in may and june, rallies followed both times…will that be the case now???