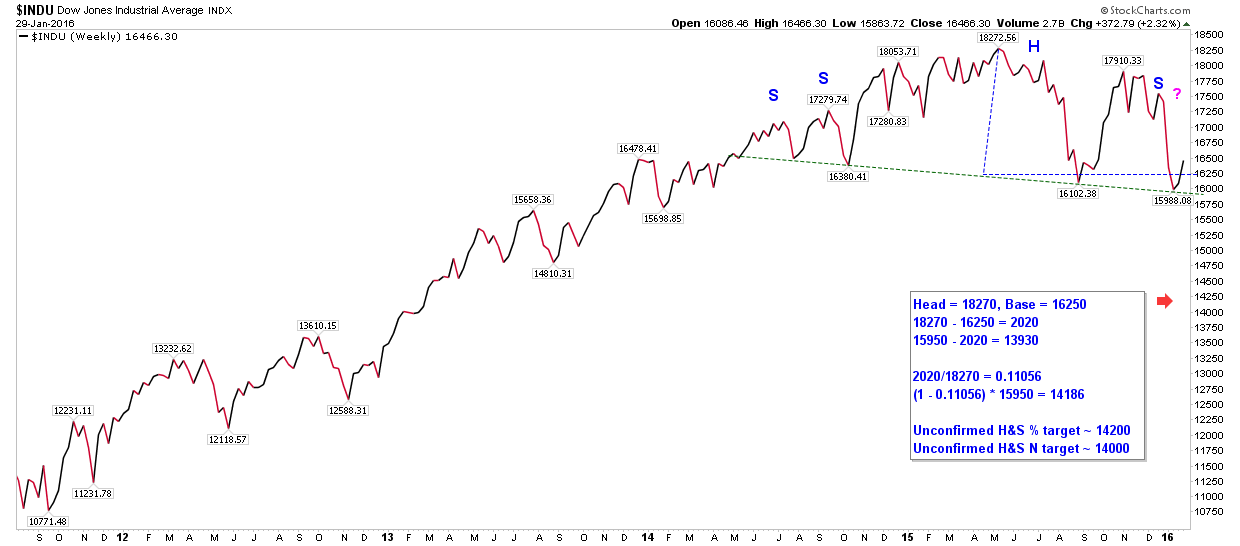
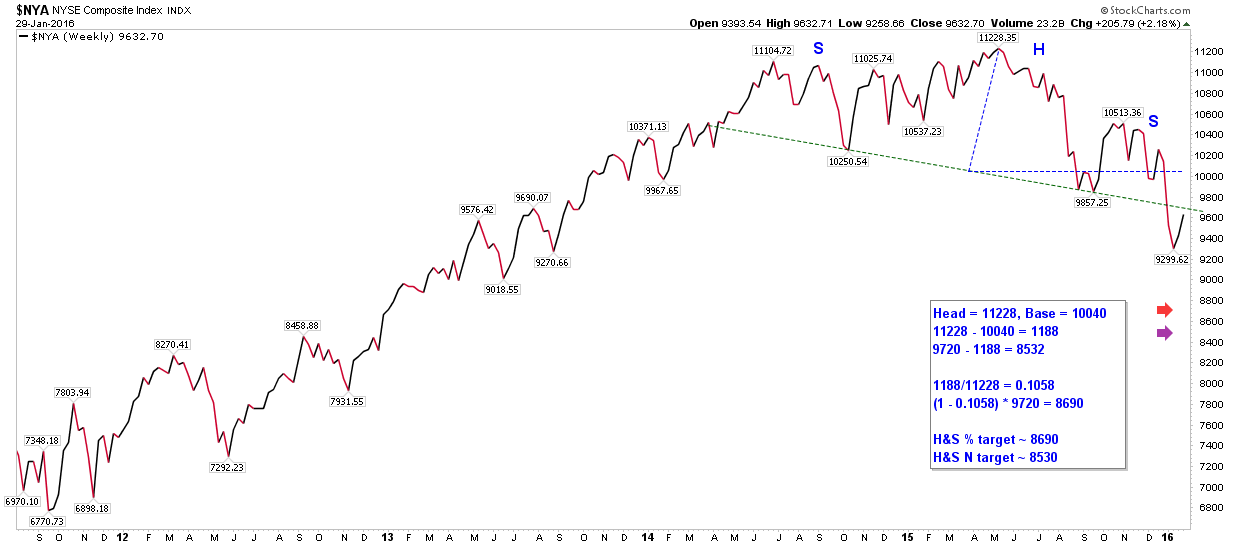
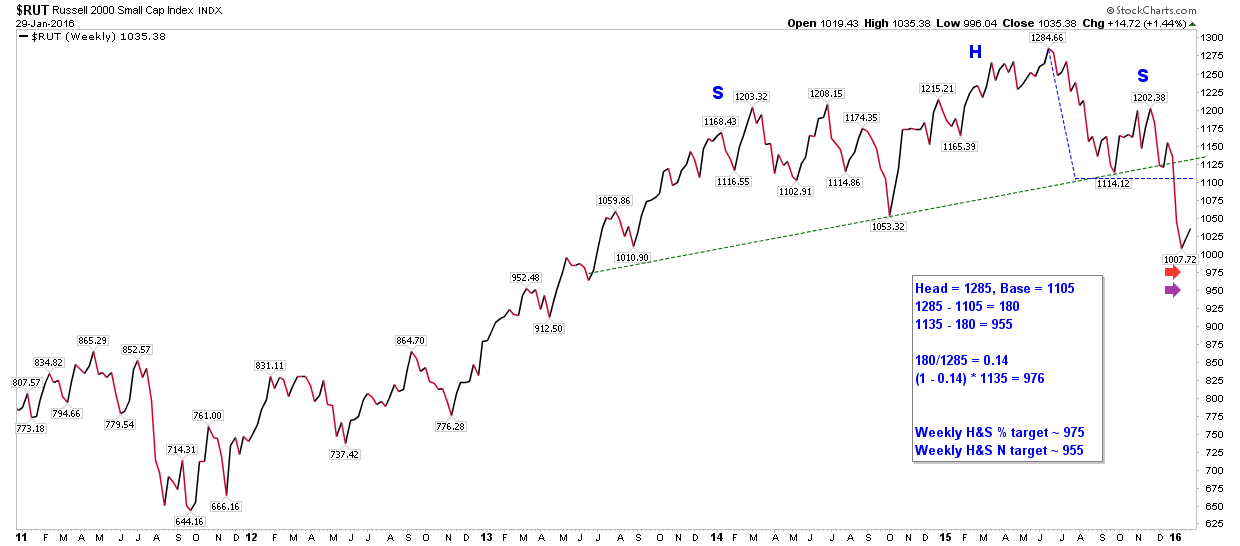
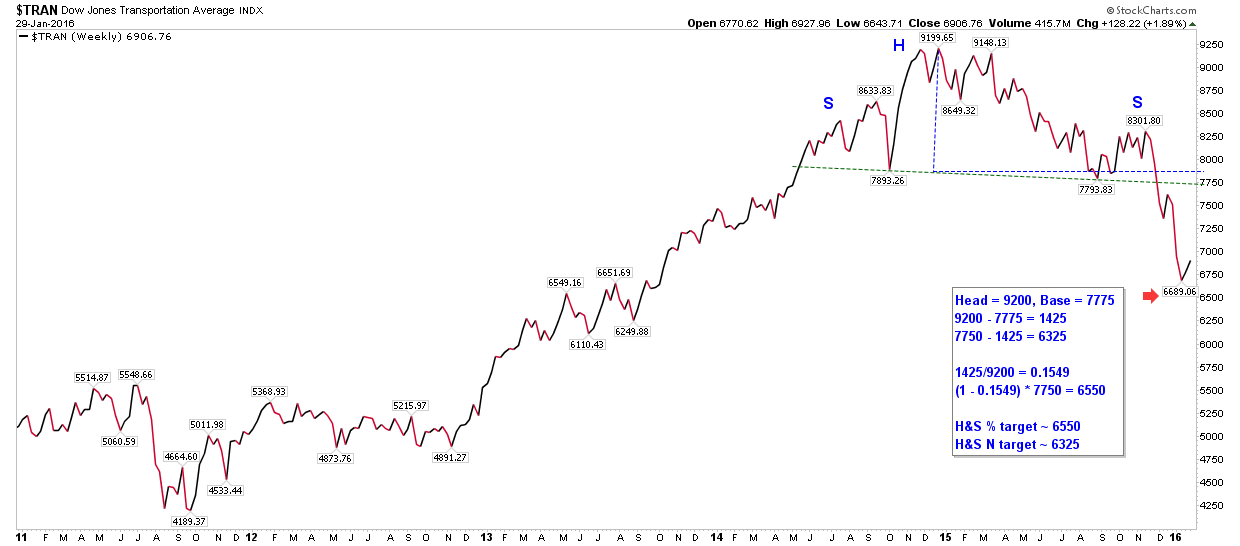
Broads Weekly H&S Patterns
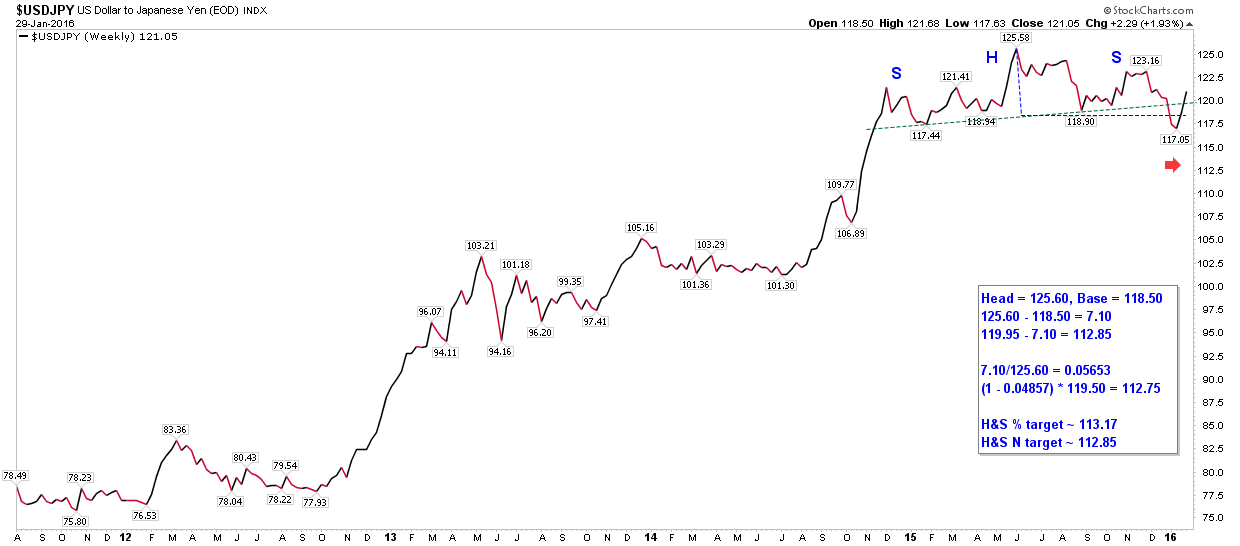
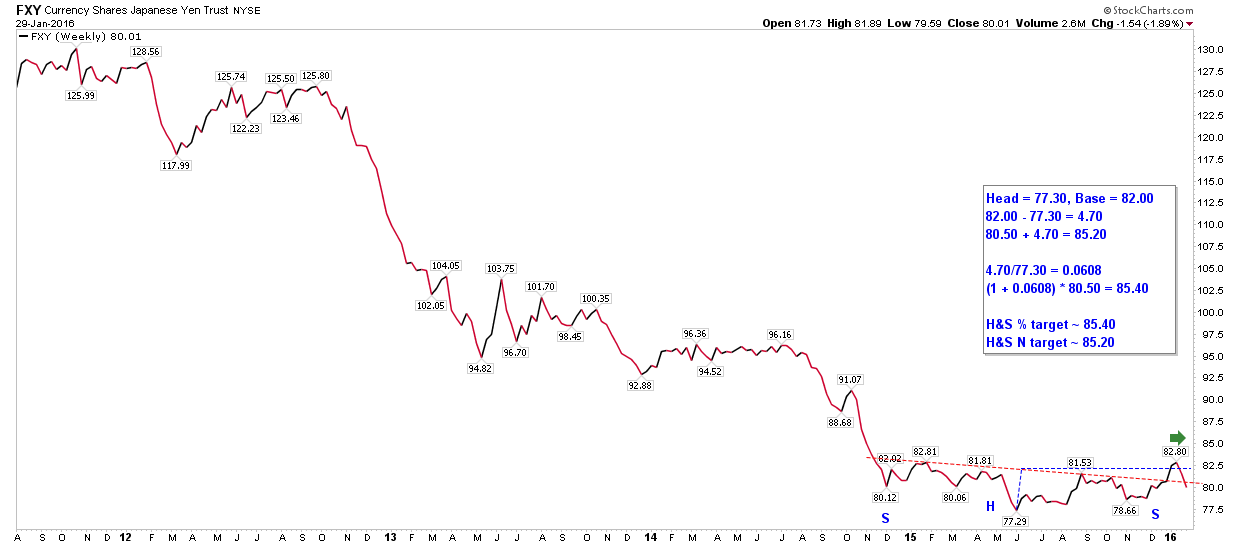
Because USDJPY correlates so strongly with $SPX I’m including both it and FXY (inverse USDJPY) because Stockcharts only gives EOD
data for USDJPY. (There’s lots of charts in this post too but there’s no other way I can do it – just the way my brain works.)
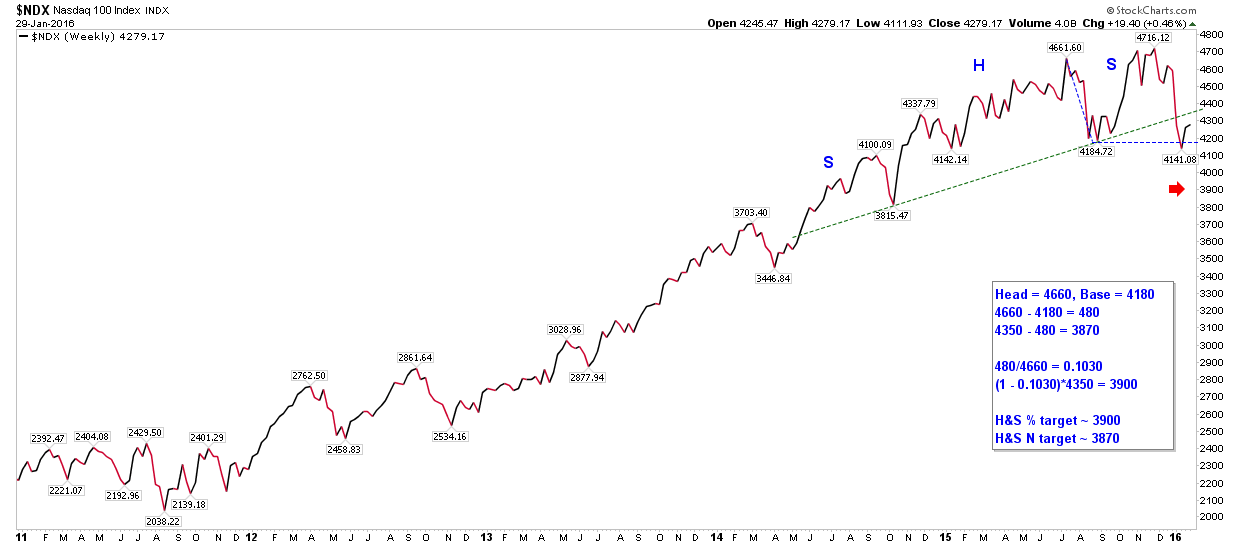
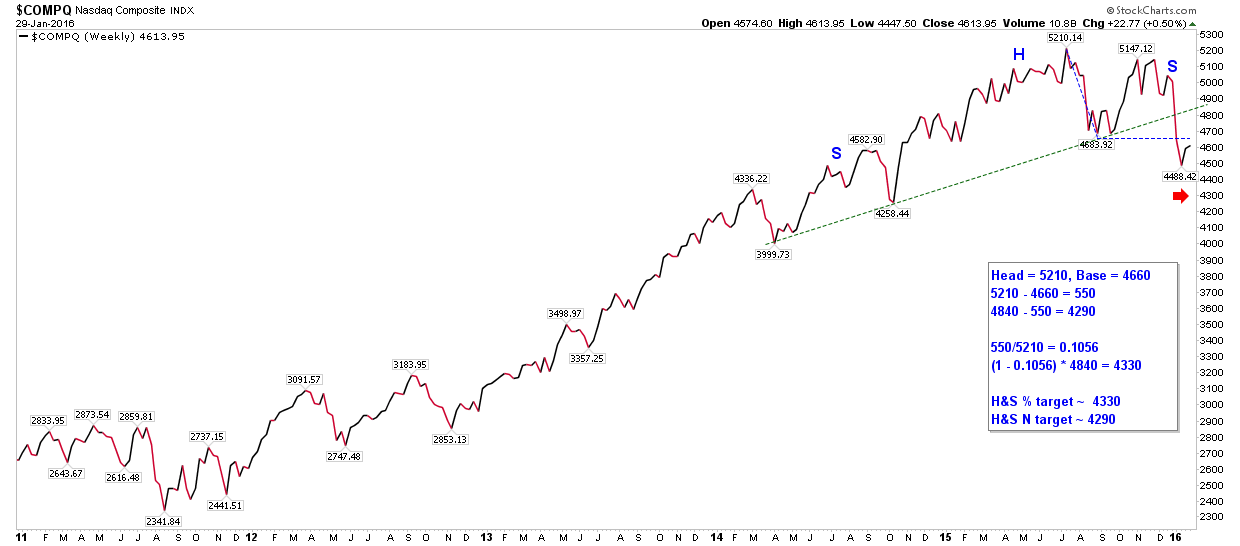
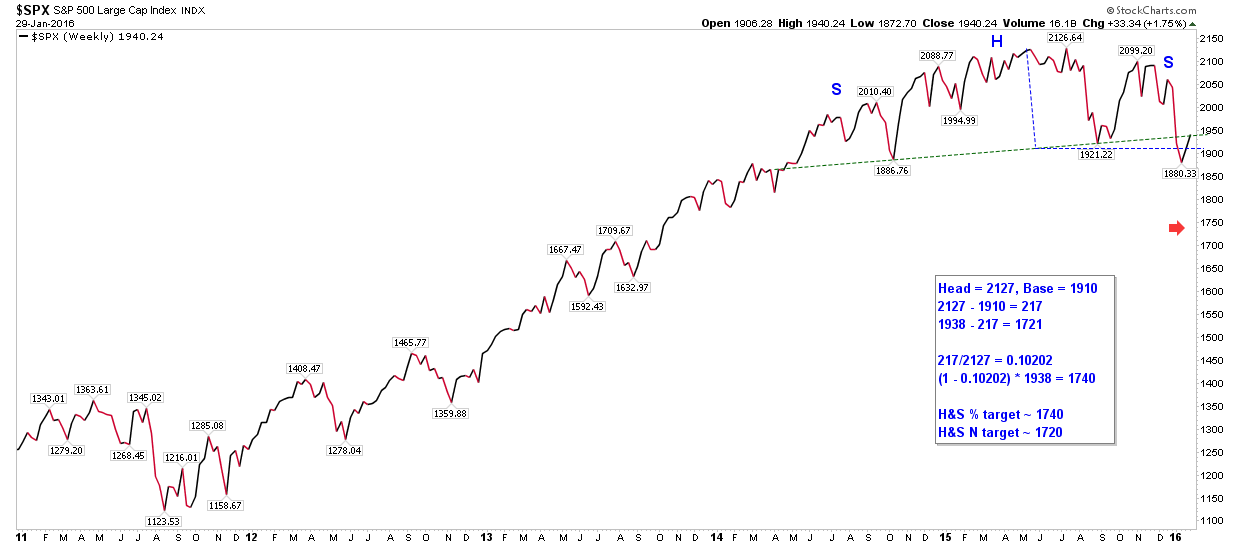
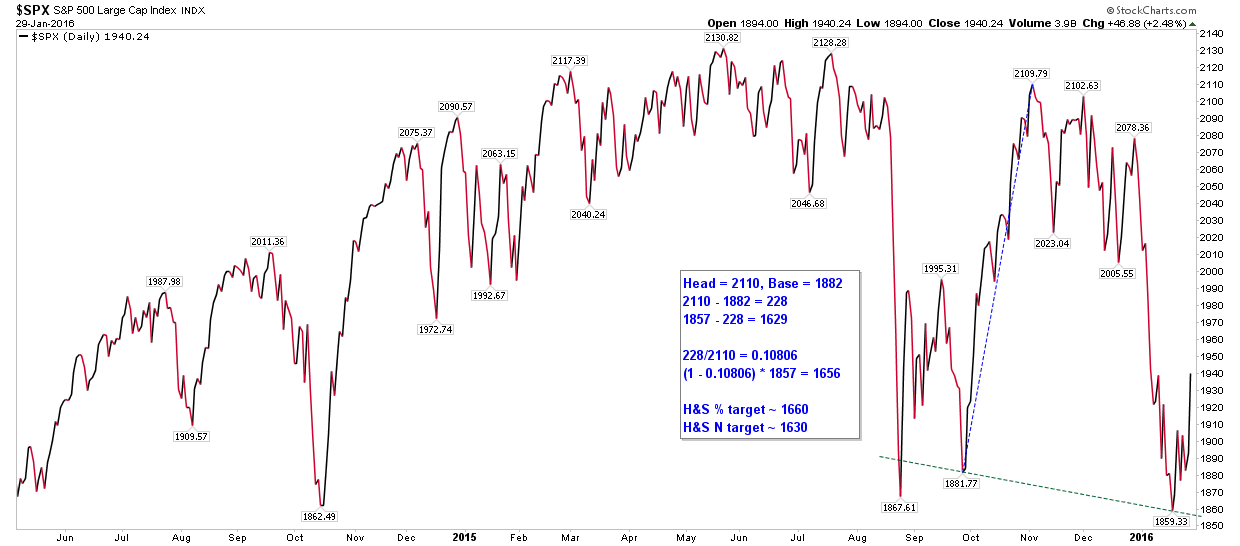
Looking further ahead, and just as a possibility, if a H&S pattern were to form on $SPX’s daily chart, the price target I have is 1630-1660. The threshold for $SPX entering a bear market is 1708, so if this target were to be reached it would clearly take $SPX into a bear market. (Fall of 20% or more, with peak being approximately 2135.) Whenever I see a H&S pattern, whether normal or inverted I ask three questions:
- Whether the target will be reached.
- How the target will be reached.
- When the target will be reached.
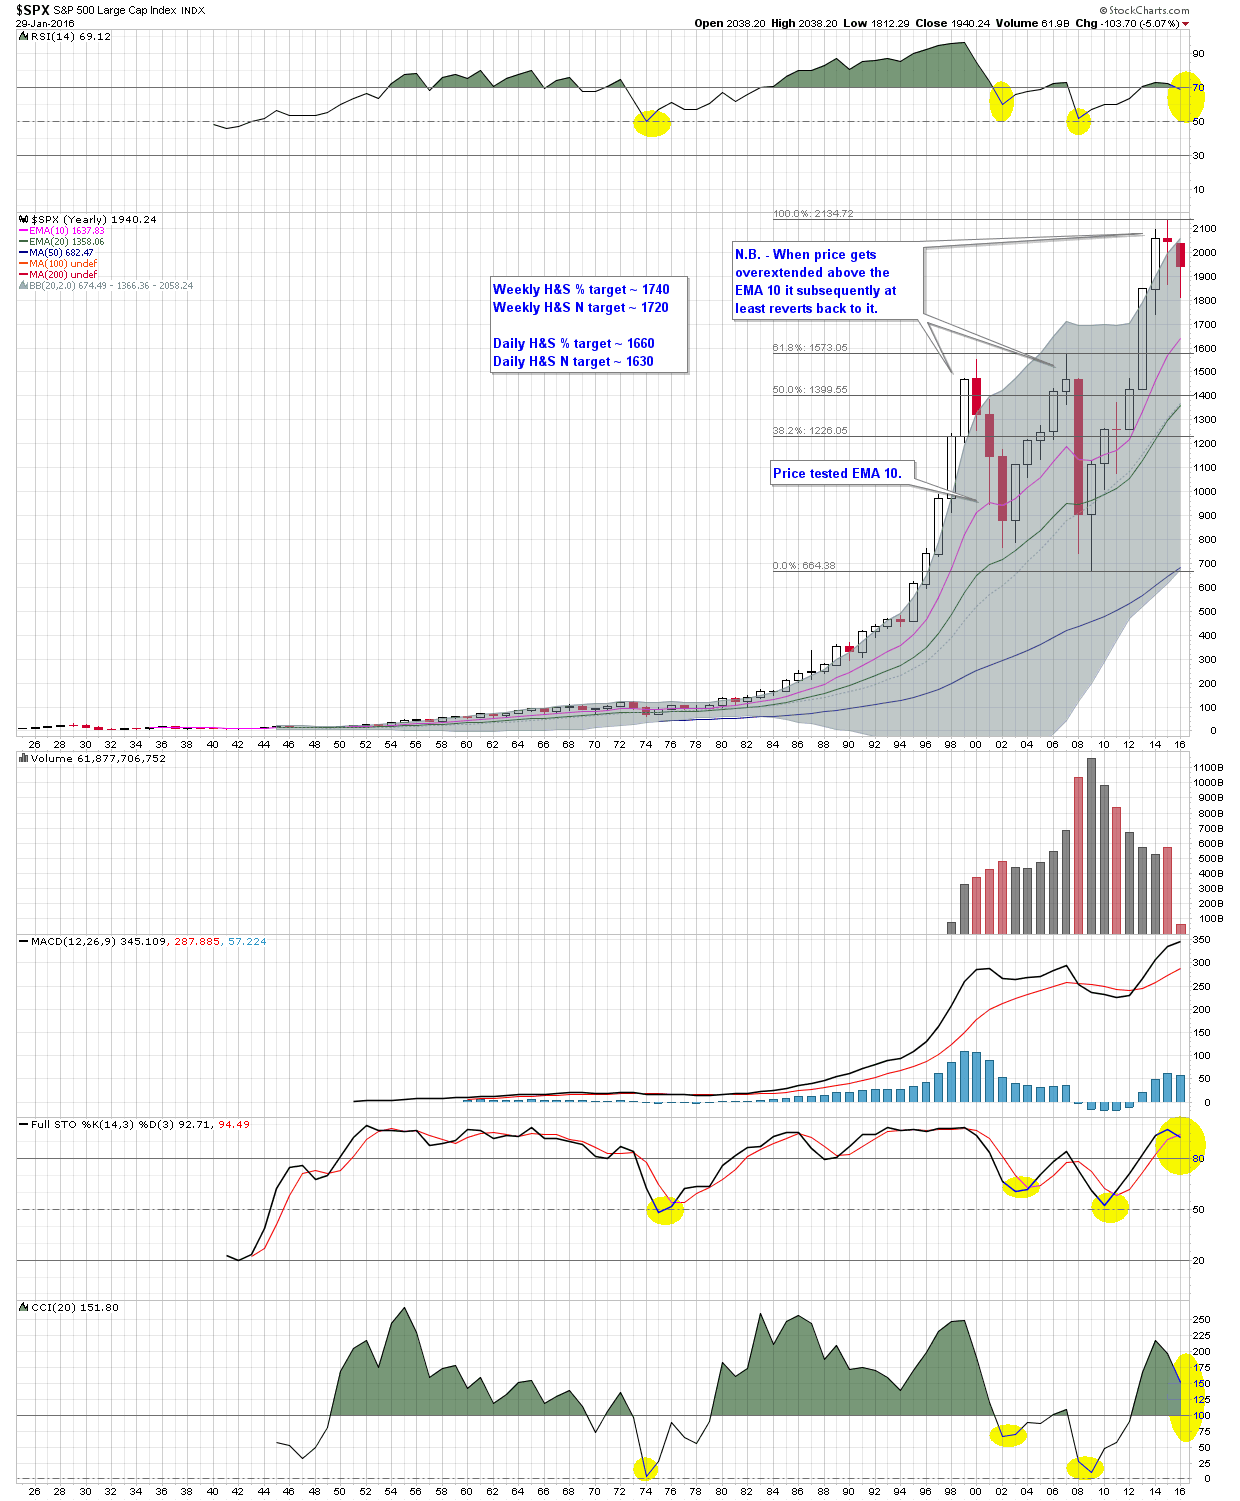
In terms of the other timescales I look at, a fall to approximately 1650 in the $SPX takes out every single MA (and lower BB) I look at. However, it does roughly approximate to the EMA 10 on the $SPX yearly chart.
nice thanks JL…good summary