Gold Bottoming system : update- verdict…not so fast .
Sorry about logging so much space here with 7 charts, but here is an update on my bottoming system. I am showing weekly charts only. They show a flicker of life in the gold sector, however ultimately we must get the indicators above the 30 W EMA and the average turned up. You know the methodology stage 4 to 1 then onto 2. It takes a while and we are not there yet. Likely we rally then cycle back down. That’s just how it works
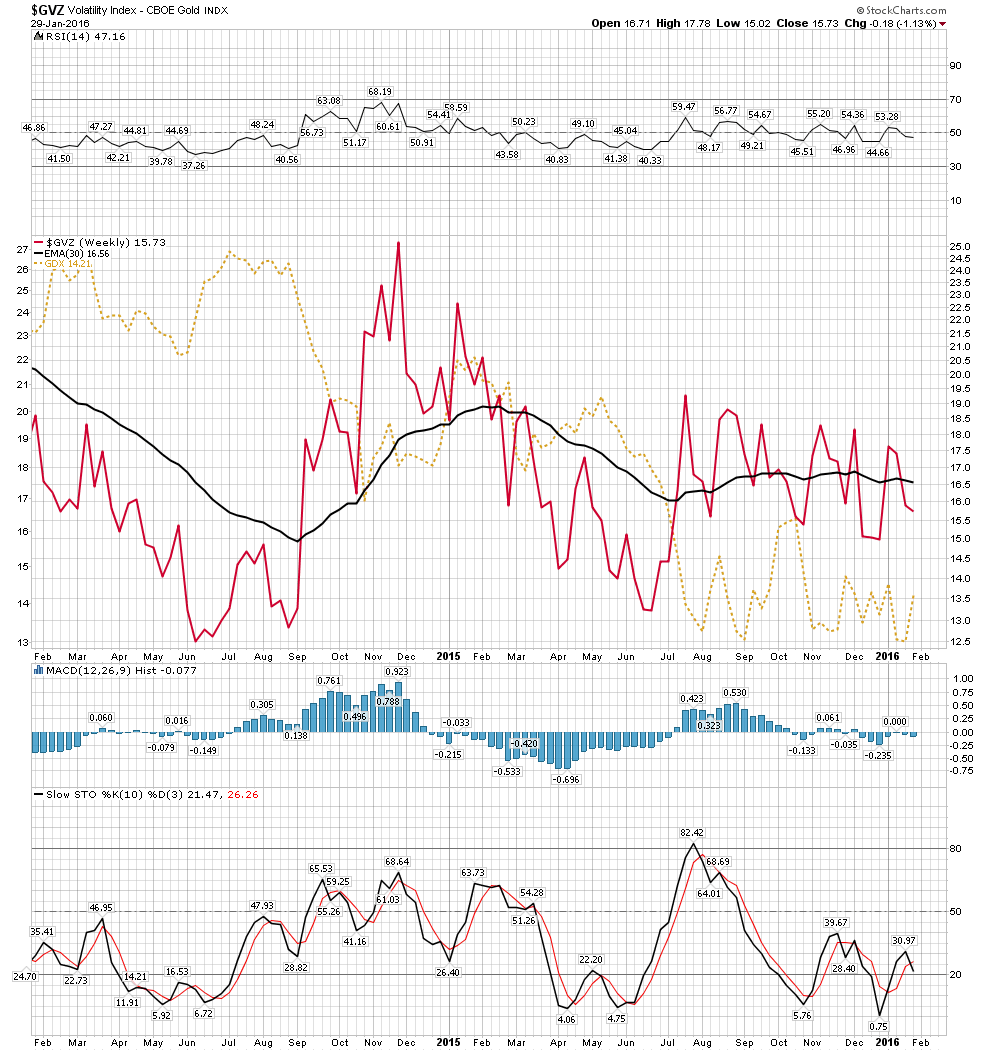
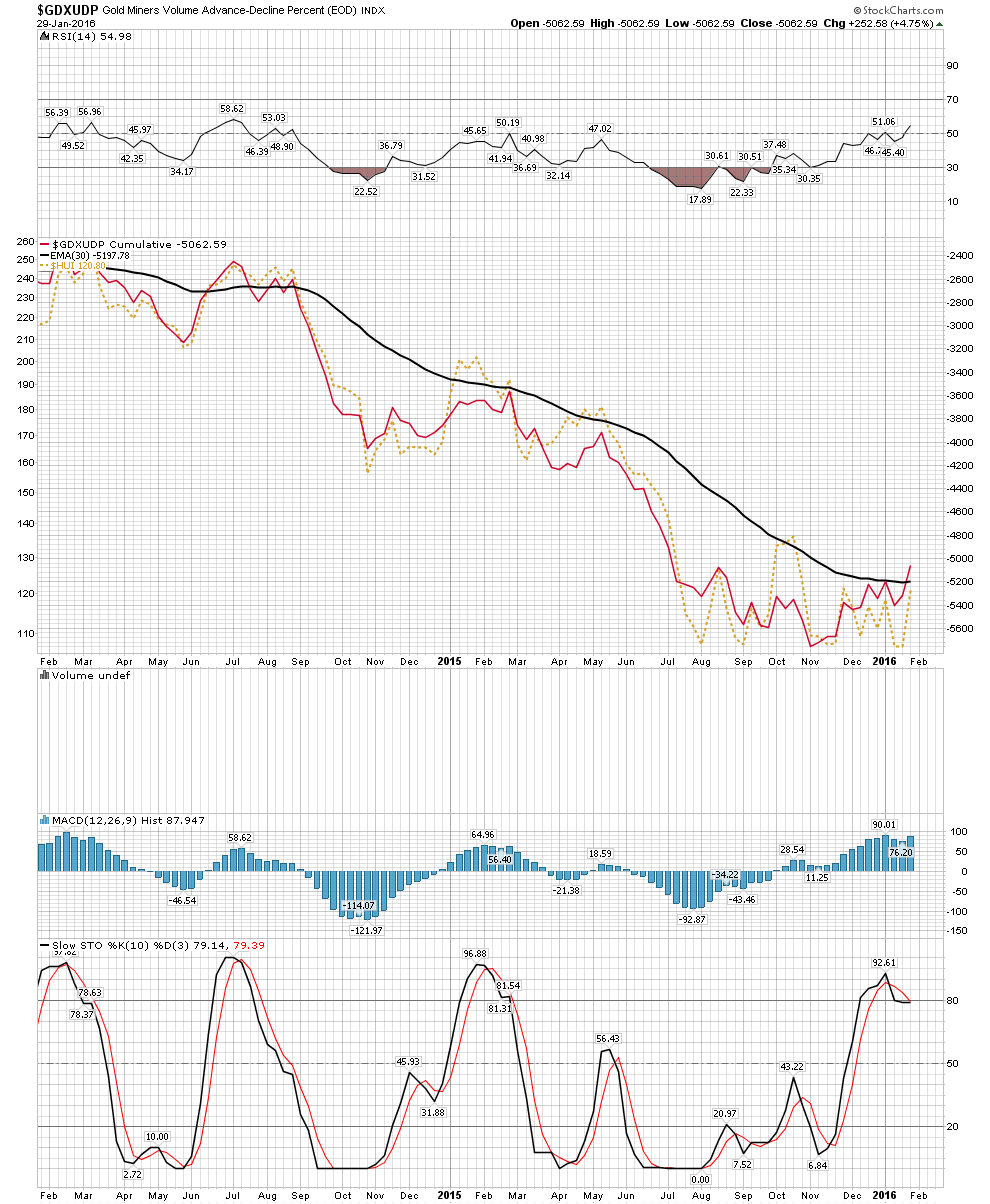
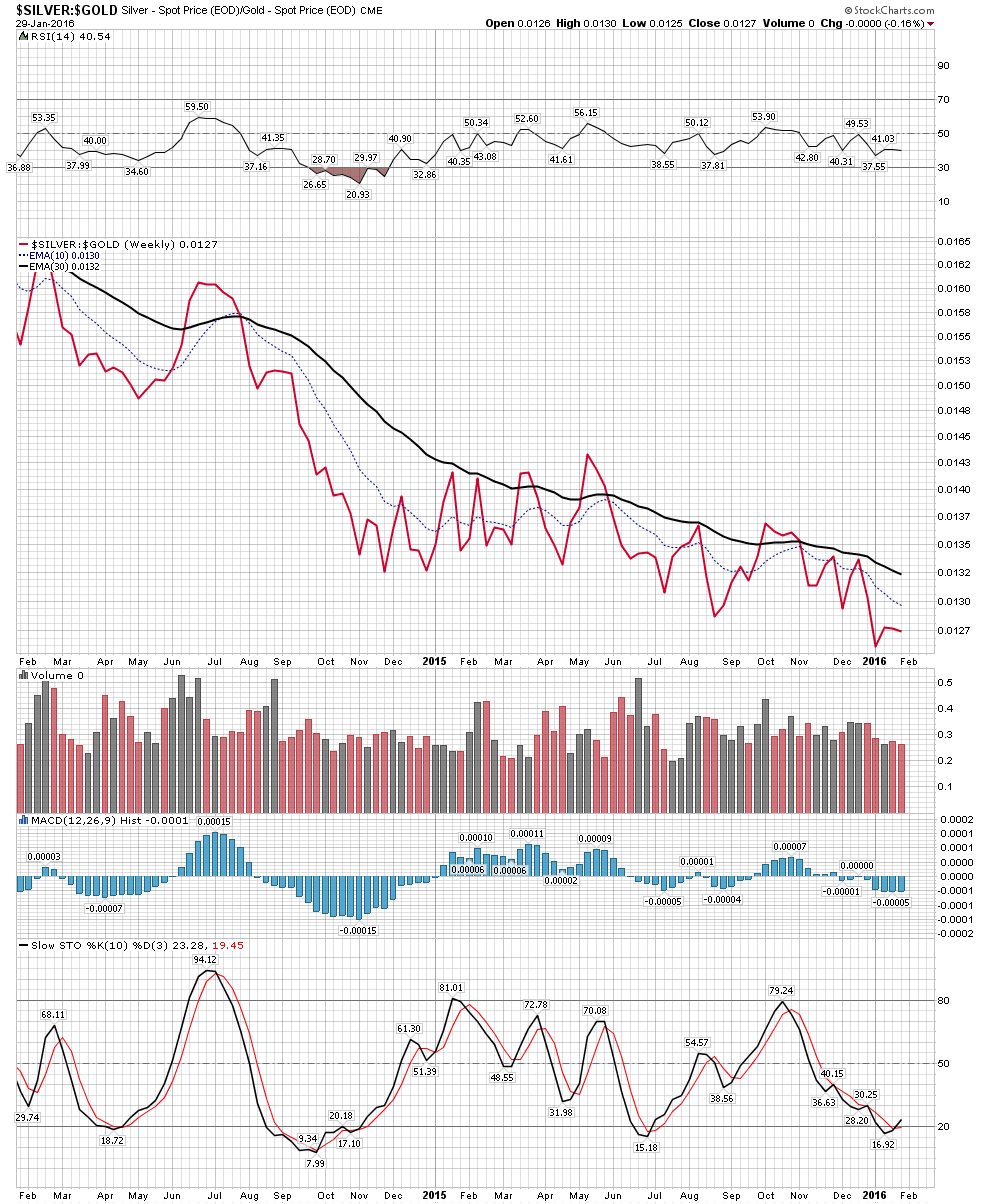
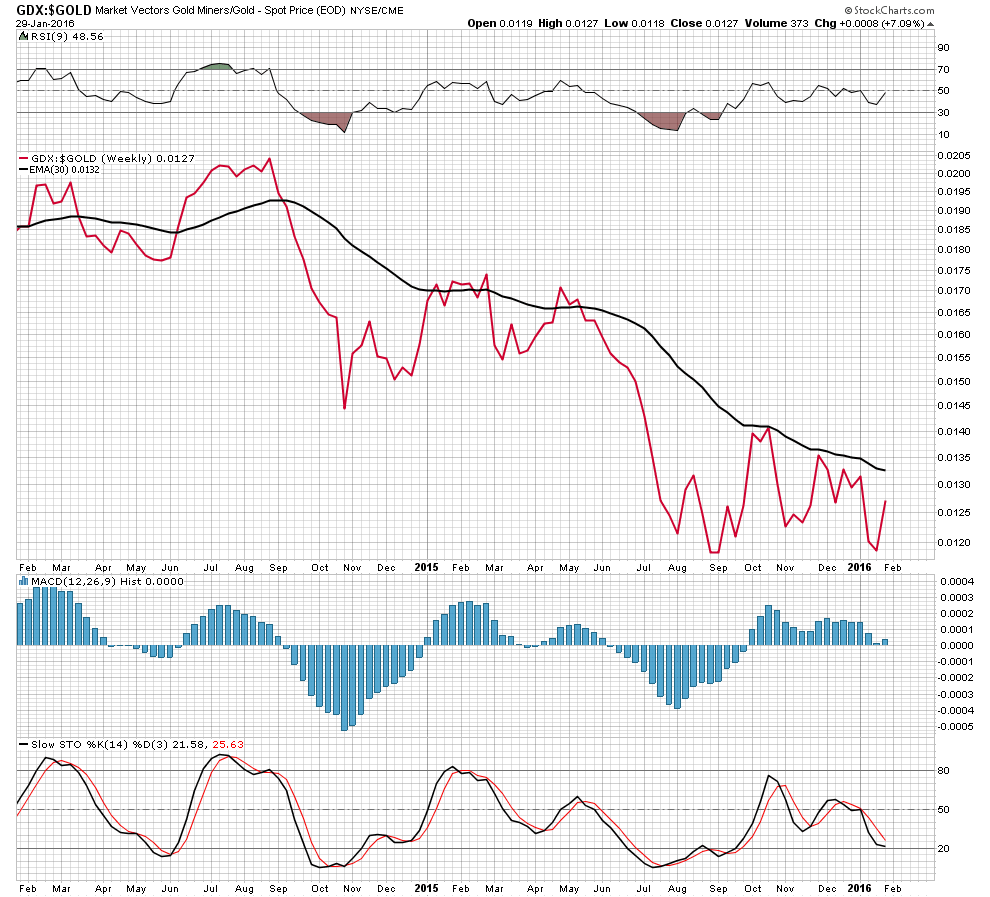
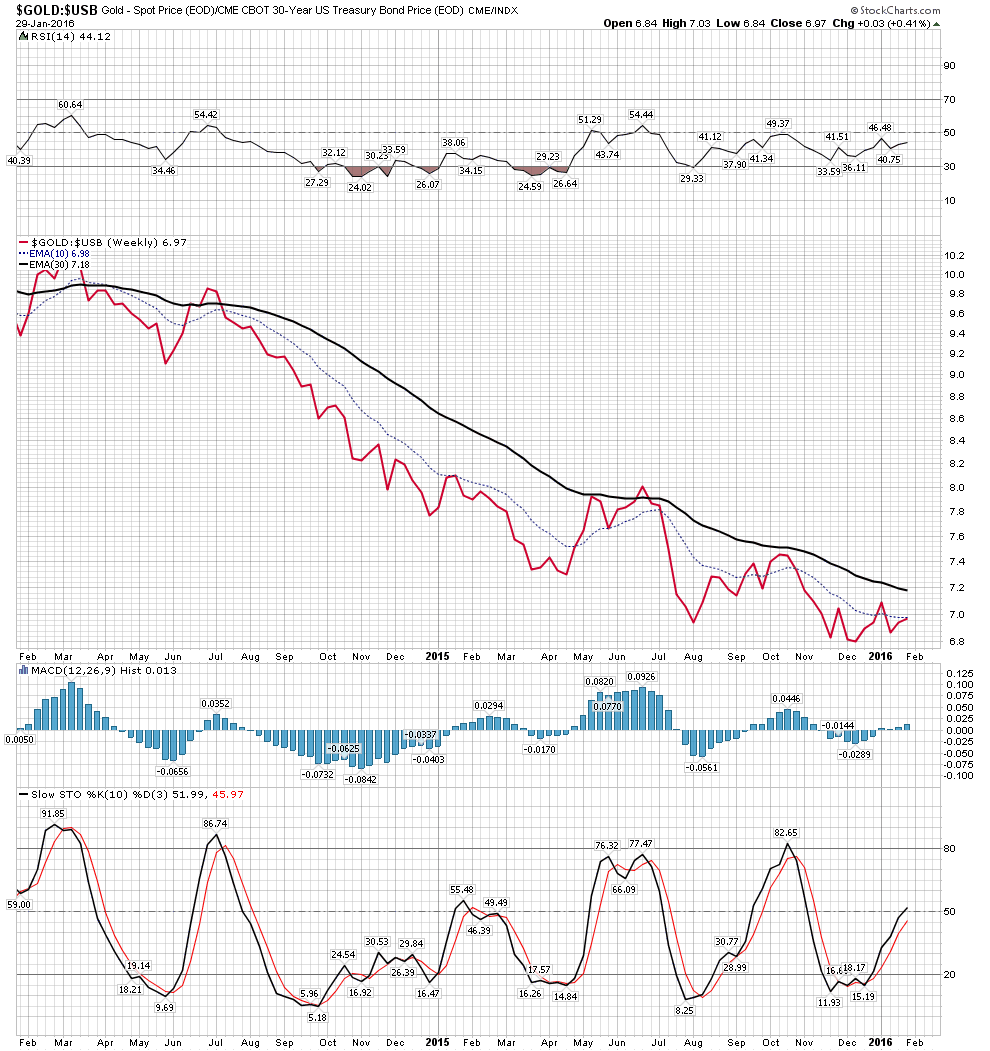
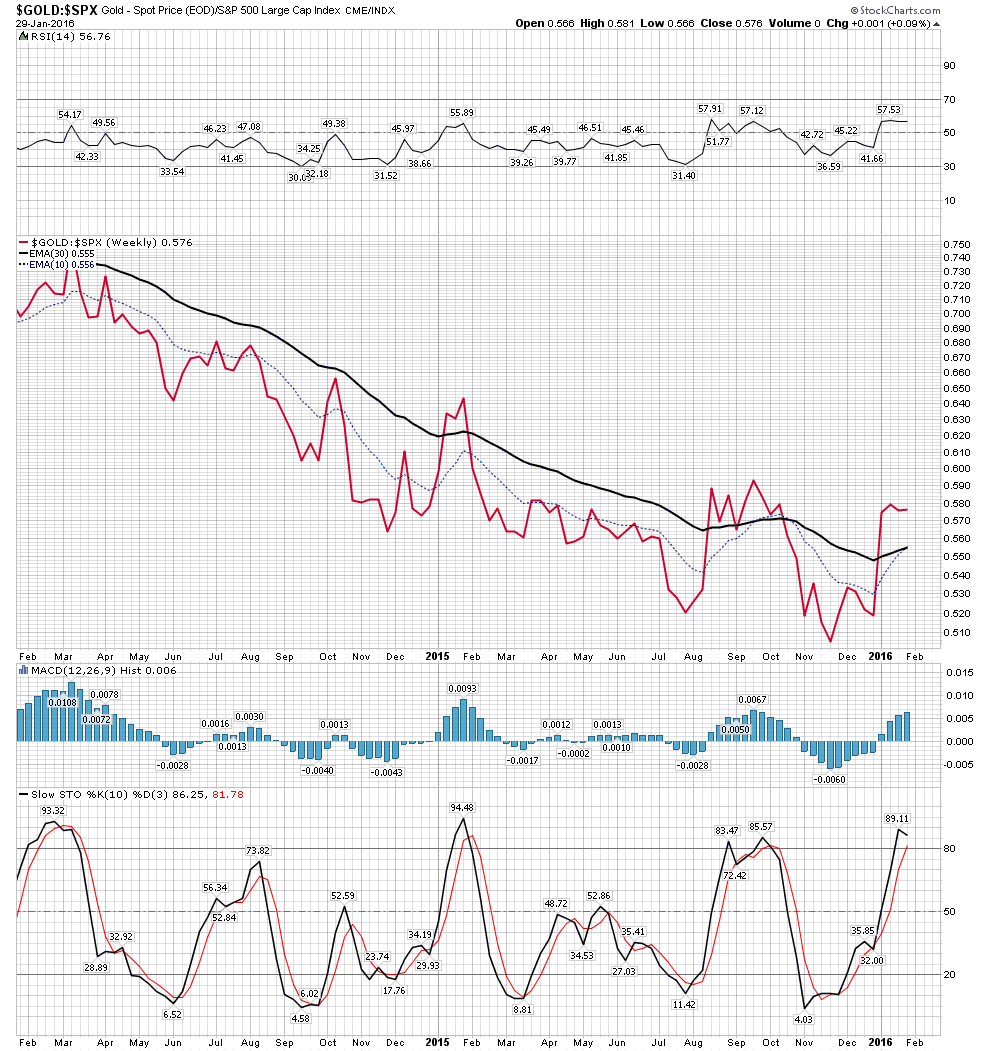
Not to mention we need a basic higher high followed by a Higher Low
But bottom fishing here with Spock cant hurt too bad if you take it slow
I usually start at the ankles!