The Gold:Oil ratio just exceeded its 36 year high.
The Gold:Oil ratio just exceeded its 36 year high.
Take a look at this. I thought I would check it out given the weakening in WTIC oil and the last few days’ pop up in gold.
My question as I loaded up this chart was: Is the gold:oil ratio breaking out to a new all time high (at least for the past 36 years) or is it hitting resistance at this lofty level?
The answer:
http://stockcharts.com/h-sc/ui?s=$gold:$wtic&p=M&yr=36&mn=0&dy=0&id=p84715185119&a=422997387&listNum=1
Gold:WTIC is 33.33, just above the high for the past 36 years which was 33.30 in 1986. My eyes are seeing parabolas delineating the lows and the highs on this chart for the past 30+ years:
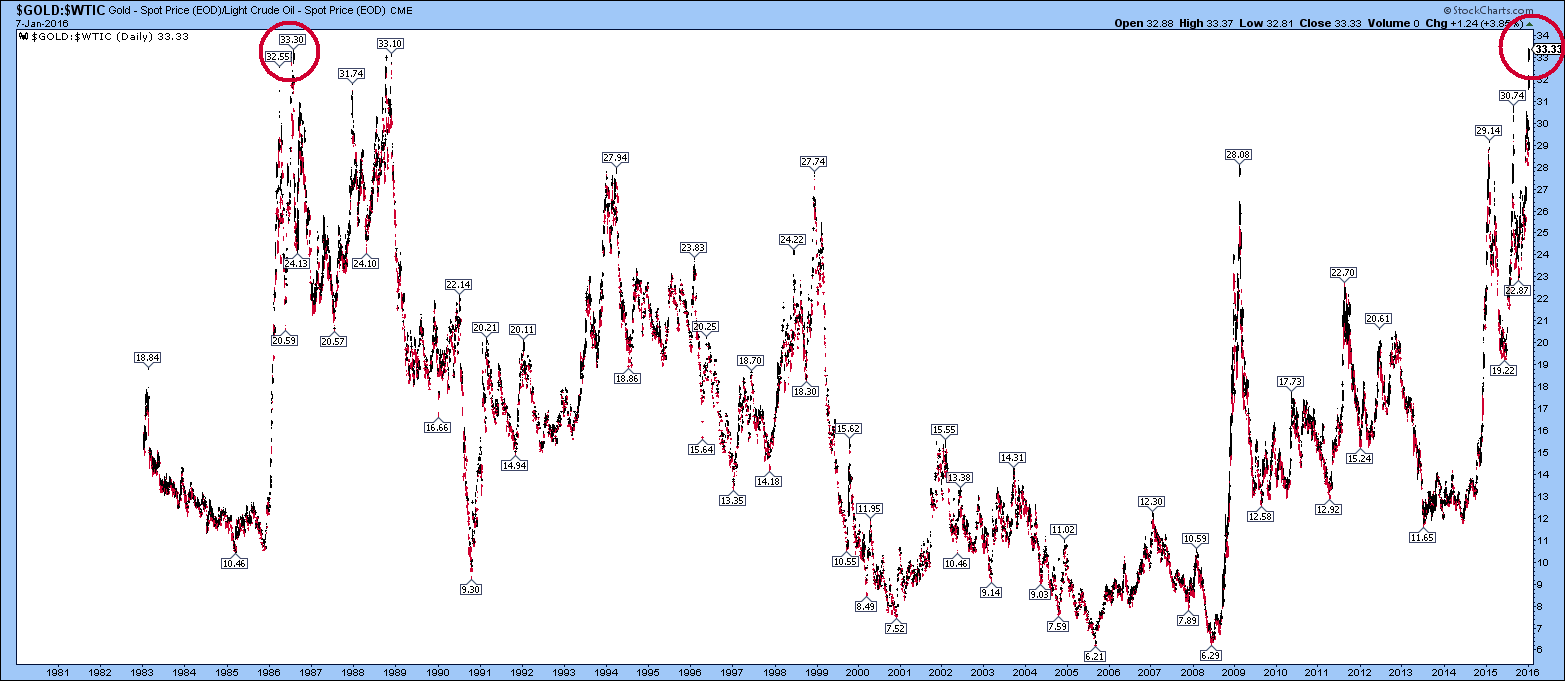
Can it break out to a new trading range as the Gold:CRB chart has?
What could that range to be? The previous range for gold:oil is 6.21 to 33.3. Can a new range of 33.3 to 60 come into play?
This ties in with Graddhyllesvin’s post with his potential bearish pattern for oil:
http://goldtadise.com/?p=359257
and also with the Gold:CRB chart that broke out in 2008/09:
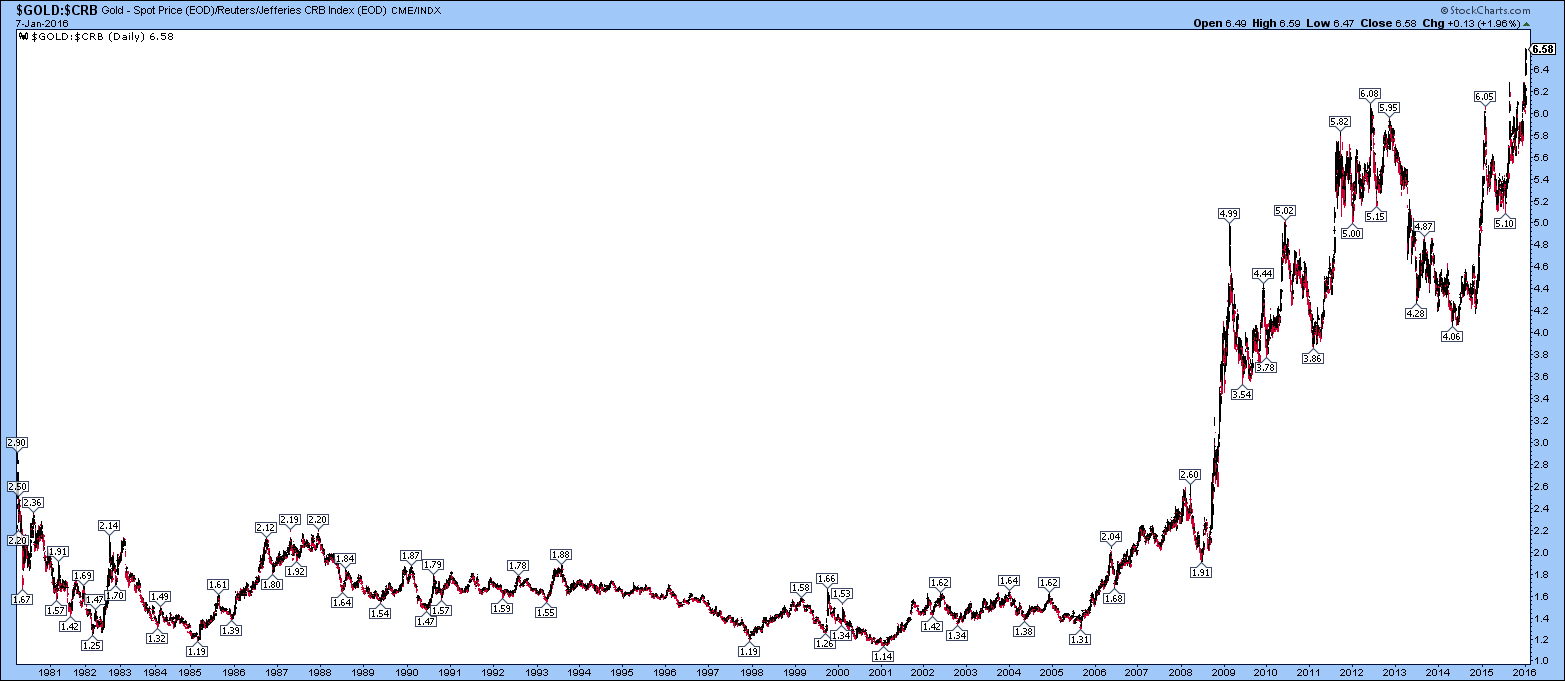
Is gold:WTIC going to follow the Gold:CRB to the upside?
Good eye Dave. Here I have covered the ratio GOLD:WTI:
http://goldtadise.com/?p=357736
The ratio GOLD:CRB actually broke out a couple of weeks ago last time. And I think these break outs mean that WTI will go down more than GOLD. I do not think it has to mean that GOLD will start to fly.
Thanks for the reply – I am checking out your linked post. I like the charts.
Here I have put together links to my main posts about the opportunity now in everything bear oil:
http://goldtadise.com/?p=359257
Yes Parabolas everywhere
33.33 is an elite power number. Wouldn’t doubt if that is the top.
It is why the highest degree of the Masons is 33.
In the Book of Enoch the fallen angels came down introducing themselves to man on Mt Hermon. It happens to be exactly 33.33 degrees north from the equator and 33.33 degrees east from the old Paris prime meridian.
What percent of the Angels fell with Lucifer?
1/3 or 33.33….
Roswell crash site. The second time they introduced themselves to man:
“Crash” site: 33.33 degrees north by 33.33XPI west….
Just some numbers for you to consider! Haha.
Looks like gold is putting in a massive inverse head and shoulder’s formation that started in 1992….
Carolynsue: could you post a chart please?
Oops. I think you may be referring ti the chart in the post which I can’t read:)
Yes you have to click on the link just above the Gold:WTI chart (the chart you can’t read)
Gold:oil has now broken out above 35 as of 16 January 2016:
http://stockcharts.com/h-sc/ui?s=$gold:$wtic&p=M&yr=36&mn=0&dy=0&id=p84715185119&a=422997387&listNum=1