Rick’s Pick Sunday Nite
USU15 – September T-Bonds (Last:152^01)
Updated June 21, 6:00 p.m. EDT
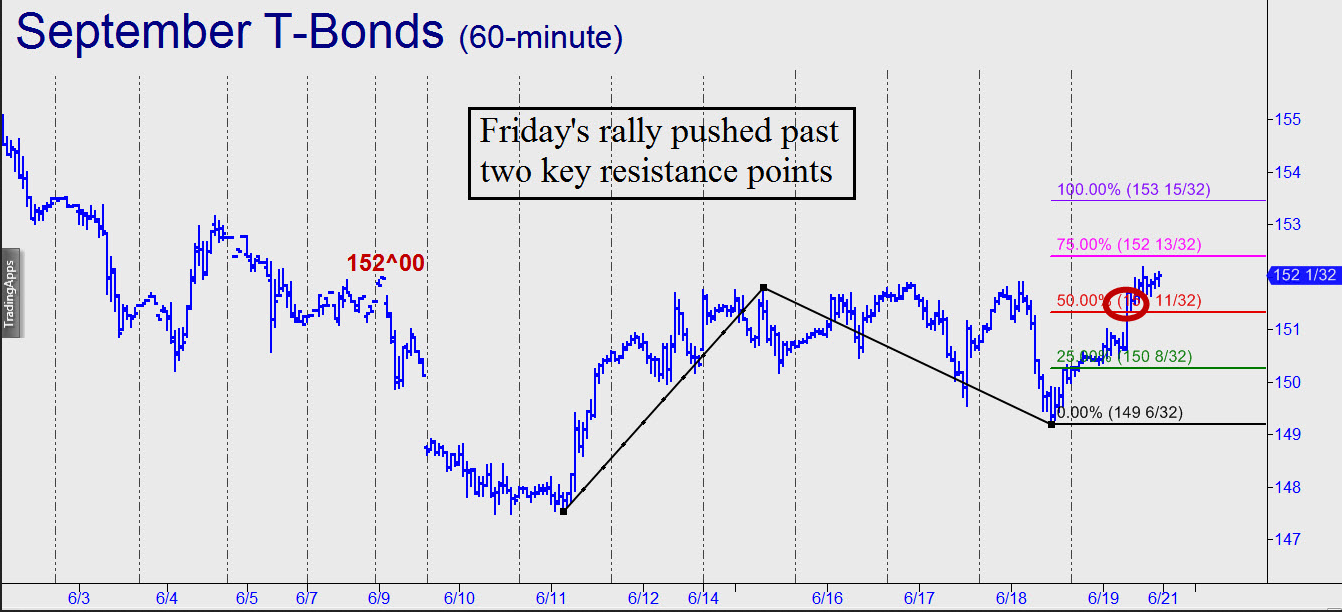
We’d expected T-Bond prices to enjoy a strong tailwind as long as Greece’s mounting financial problems remain unresolved, and so far that has proven to be the case. The question is, are there additional bullish forces acting on T-bonds that could continue to propel them higher even after the Europe’s spinmeisters announce a supposed remedy? That is the same as asking whether the very nasty correction begun in early April from around 167 is over. It’s still too early to say, although the rally looks promising. Technically speaking, Friday’s upthrust was especially encouraging because it exceeded an external peak at 152^00 recorded on June 9, creating a bullish impulse leg and re-energizing the hourly chart (see inset). Notice as well that the move decisively exceeded the red line, a midpoint resistance at 151^11, implying more upside over the near term to at least p2=152^13, or to 153^15 if any higher. If that last number fails to slow the rally down, it would add to the evidence that the rally is not just a flash-in-the-pan