VIX
 I don’t trade the Vix but it is one of the many things I monitor. I also don’t write about it often. The last time I did was when I discussed the chart showing three consecutive cups in a pattern that was calling for a reversal. That was just a few days before it began it’s upside run in conjunction with the sharp stock market decline from mid July to Aug. 5th.
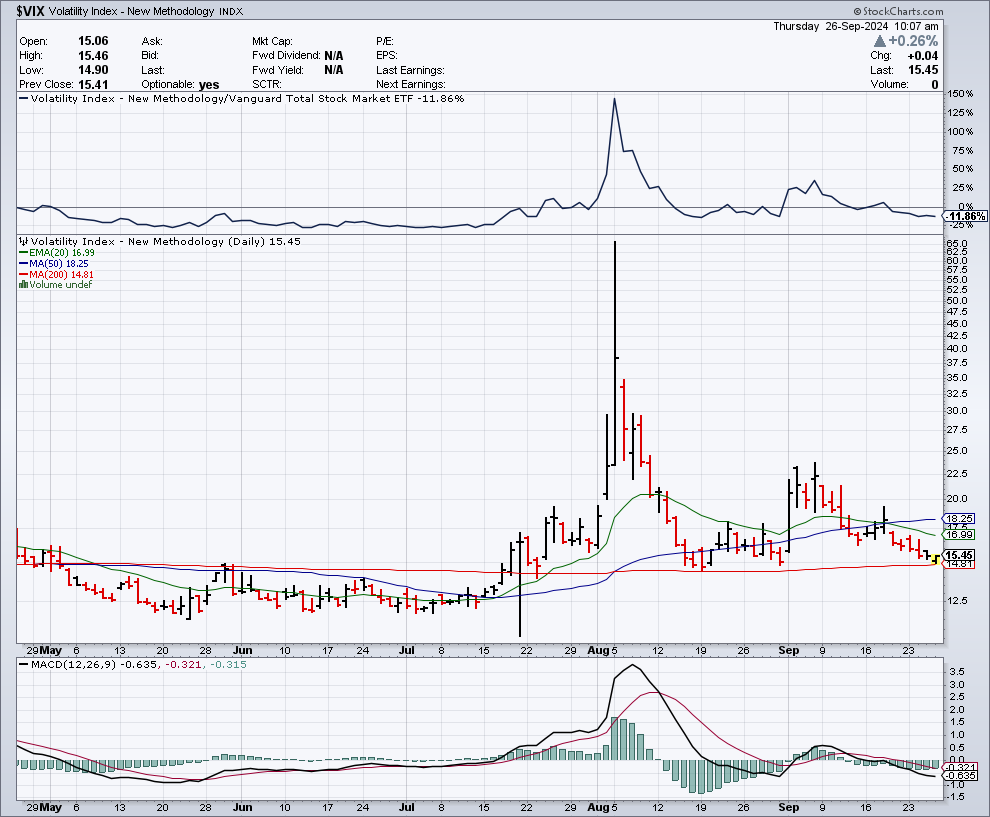
With today’s stock surge and VIX drop, the chart is presenting another interesting pattern. Triple Nines. Counting from the low on Aug. 19th, it was nine trading sessions to the next low on Aug. 30th. Nine trading days later brings the third bottom on Sept. 13th and now nine trading days later again, today brings the VIX to a hair above it’s 200 day mvg.
I suggest today marks another lower low for the VIX and likely signals a top today or by Monday for stocks. Like last time with the three cups, the stock market decline will probably take at least a few days to begin and build momentum, just in time for the usual October weakness.