GOLD LONG TERM LOG CHART
Chris B emailed me that the Linear Chart I posted Friday may be a little misleading as long term charts are best presented in Logarithmic Form as it’s the % change that matters
I confessed I used the Linear Chart for the Sensationlism and Dramatic Effect !
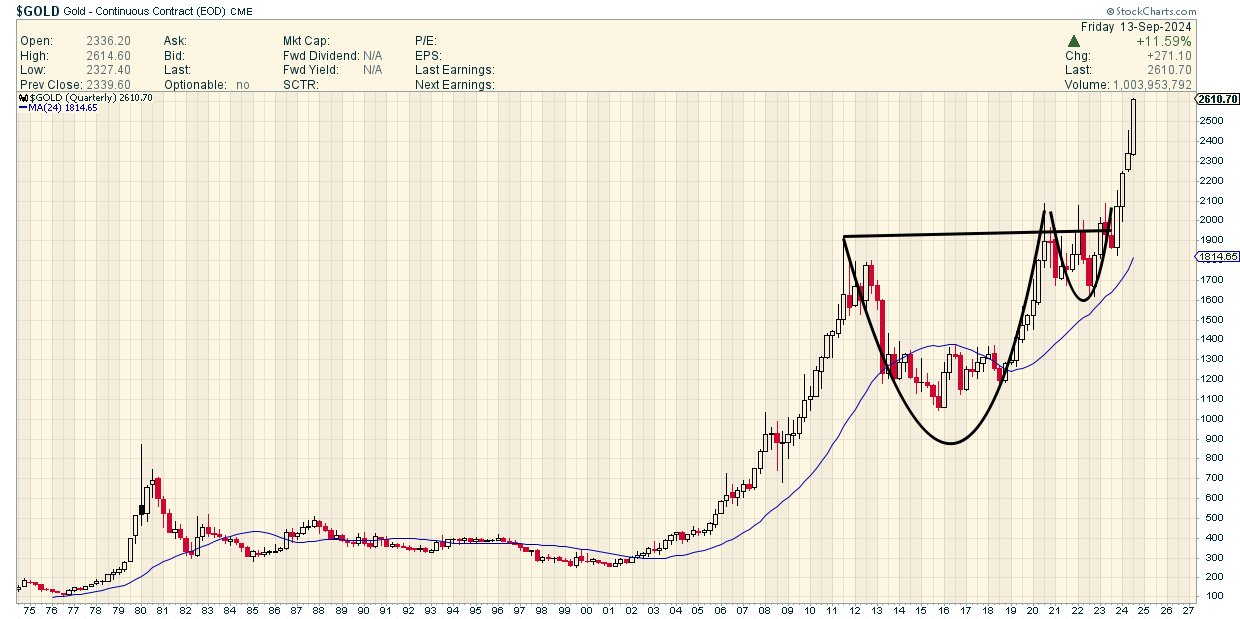
But I agree The Log is a more honest representation albeit LESS DRAMATIC …EH ?
So here is my “Bump” on a Log Chart
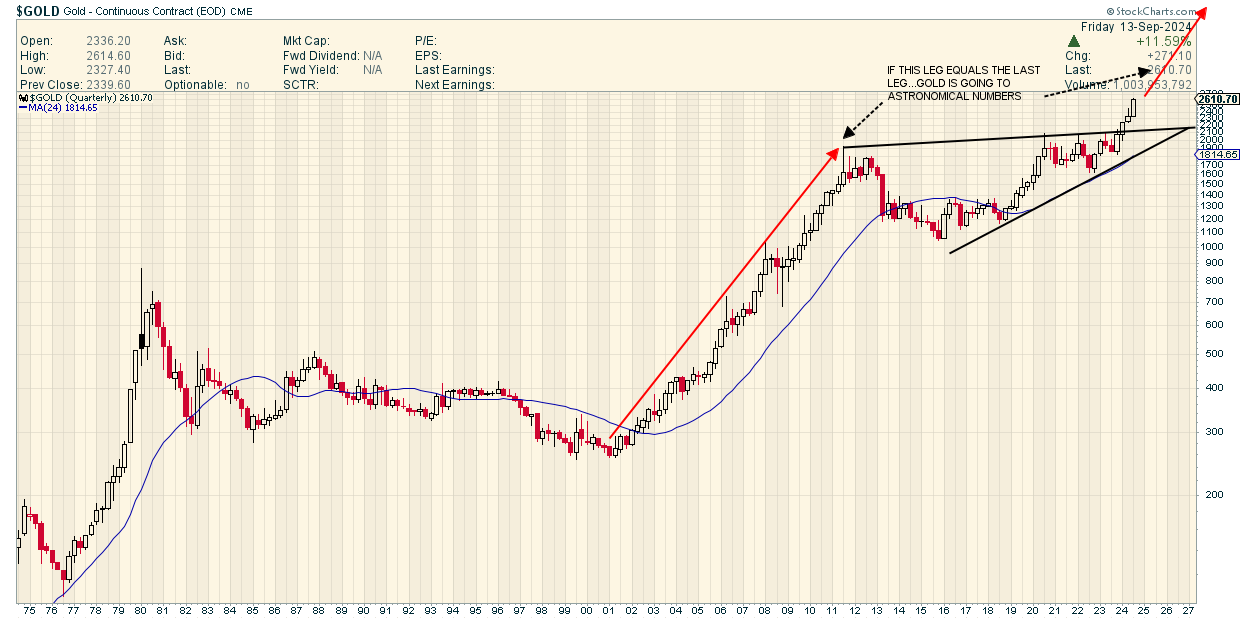
That arrow on the top right ? Projects to…THE MOON ( estimating $100,000 ) by 2034
PS Remember while you still can to Tell your Heirs where your stash is buried 🙂

As you can see the log chart is actually more bullish as it doesn’t look over extended. Actually can’t get more bullish that that. An upwardly tilted Cup & Handle…. hold on!
You must have read my mind Plunger. I was just about to post that the log chart is less parabolic looking so it has a longer time frame to run even if it takes a bit longer to reach those impressive levels.
And for anyone that doesn’t have an heir — please consider sending the location of your stash to me — to ensure that it doesn’t go to waste of course!
You’ve always been a sensational guy, Fully, admit it…
Often wrong, but sensationally so…