RGLD
I trade mostly ETFs, but RGLD is one of those very few single firm tickers I have in my system.
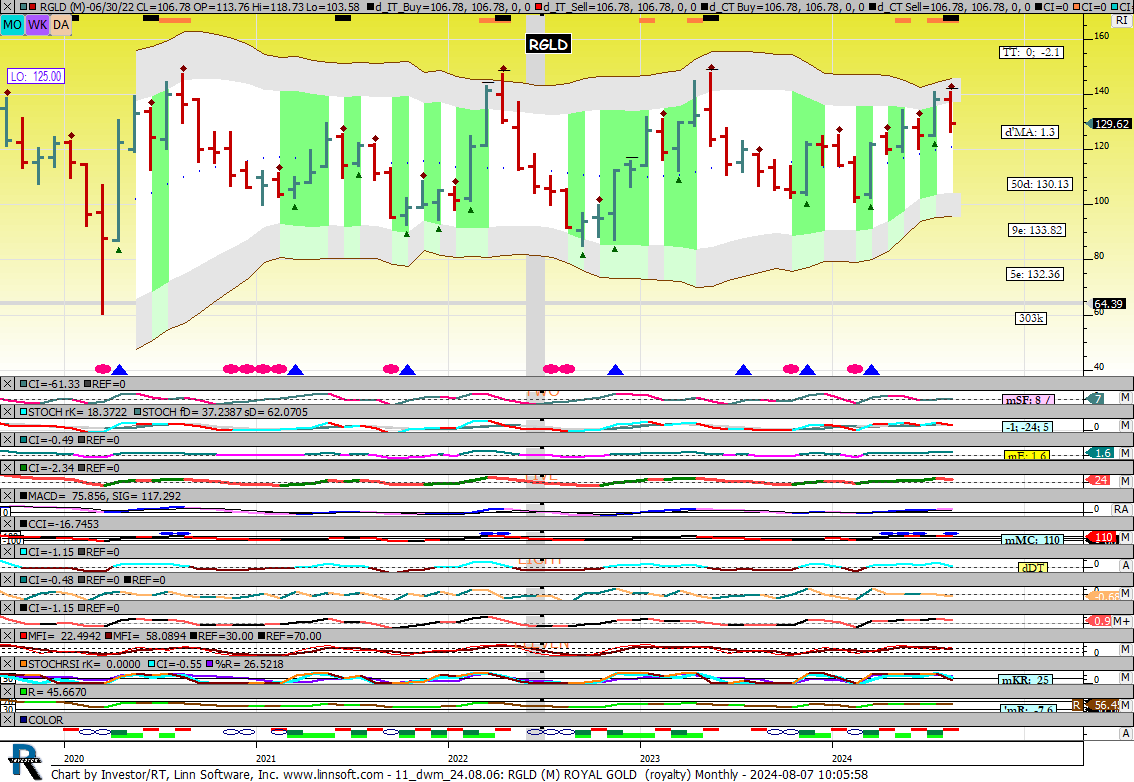
This is a monthly. Entirely useless for short term players, perhaps.
“To me, I see almost no downside from here,(it has already taken place) “
I see basically sideways for five years, bouncing between the upper and lower bands.
One pattern stands out. A high over the 2sd band into the 3sd band in gray, draws in sellers.
That just happened, again, for the fourth time in five years.
The next move tends to be back down to the lower bands, around 100 ATM.
Note the black rectangles at the top. And then track what follows.
It doesn’t always work; its simple pattern recognition. My way of gauging odds.
If you “like” this name, I prefer to wait for lower risk shots. Not high(est) risk ones.
That means wait for the red ovals (OS) followed by the upturns in blue triangles. No red oval in sight here.
YMMV.
Just a serious chart reader here.
NTA.