GDX update
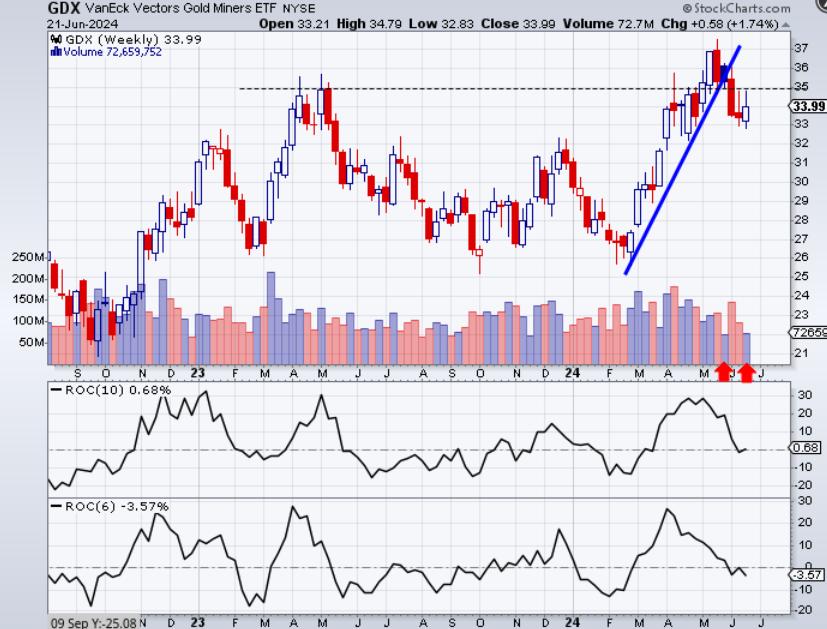
This chart was posted a month ago, flagging potential correction (since it was time) and watching trend line break:
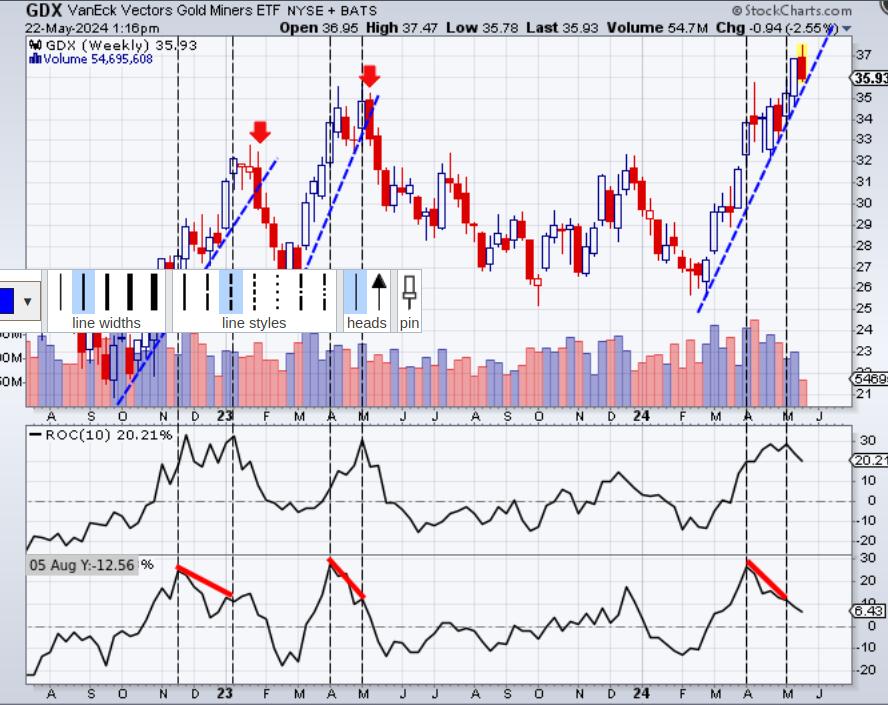
Trend line got broken and level bellow $35 marked correction. 4 weeks later price actually holds better than I though it would. I though it would be lower by now.
What is next? I have no clue of course. 😉 If price goes back over $35, correction is probably over. In this case it would indicate failed break down. Failed patters tend to be more reliable than patters itself. (trade the trader)
But if I would have to guess, I would say probably lower from here. Corrections usually don’t last this short. Also, if you look at volume, up weeks have smaller volume than down weeks. Although volumes are less reliable than they used to be. All those dark pools, and high frequency trading distorts the picture.
Bottom line, I have no clue, holding my positions and just sitting tight.
P.s.
I like to hear what Kuppy is thinking and doing. Here is his latest:
https://pracap.com/the-culling/
He is keeping his core and selling the rest. His core (few weeks ago, no reason to expect any change)
1 – physical uranium through SRUUF (Sprott U3O6 trust)
2 – VAL (Valaris – offshore)
3 – JOE (St. Joe – land and development in Florida)
Forgot his latest addition few weeks ago, March or early April – AMRK A-Mark – gold company. I have no clue where is ranks between 1-4 top spots, probably #4
(plus few other positions)
Top 3 core positions are in his portfolio for over a year and are LT hold.
Thank you, Buck! Great report. Honest as hell…I love that!
Gotta say, I love your presentation!, Buck! Let t roll.
I missed the i, if that is cool, it’s accidental.
With you so far.
I still see others calling for MAJOR upside after this correction completes, including Sam and Avi. But Avi warned Friday of a pending reassessment based on non impulsive 1/4? overlap in silver.
My longer term take still differs, as noted previously. I saw a major high.
In Chartology terms, I see the Friday breakdown as clue that we were in a mid course sideways (off that top – 2 or B) and your lower lows are still ahead (3 or C). But its also possible we challenge the old highs before that happens. Near term is not clear.