Perspective – is $30 or even $50 silver ‘high’?
macrotrends.net June 1915 to current.
Consider that 1971-1974 could be a fractal of the 2000’s (first wave).
Note the symmetry of the rise and decline 1968 to 1993. Could we be looking at upside continuance of ’04 ’07 and ’11 peaks, before true value clears markets (note 2011 still held momentum despite the GFC)?
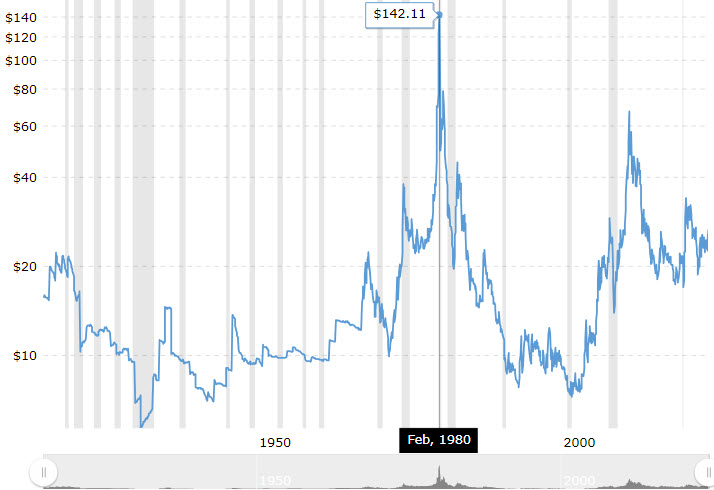
I would also mention that 1966-1968 prior to delink of USD from gold – SILVER was already smelling out relative true value of PM’s after being pegged until 1966 (where the chart starts). Was it any wonder France was plundering Ft. Knox?
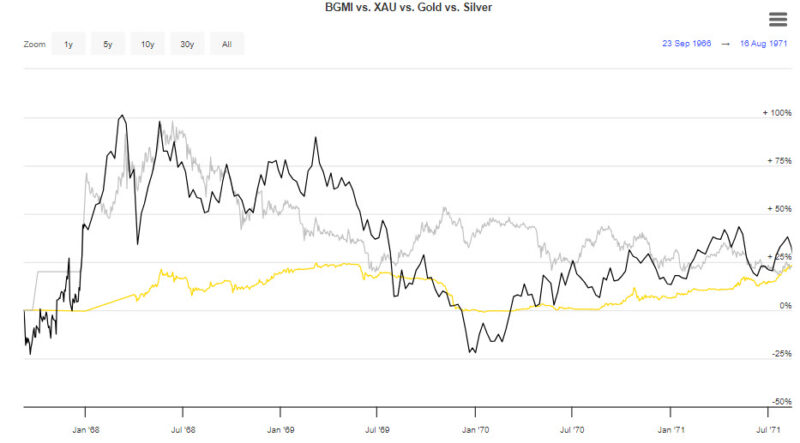
longtermtrends.net
Fascinating. We likely will all be astonished at what unfolds in the next few years.
If earth makes it that long
“I would also mention that 1966-1968 prior to delink of USD from gold – SILVER was already smelling out relative true value of PM’s after being pegged until 1966 (where the chart starts). Was it any wonder France was plundering Ft. Knox?”
The taking out of JFK prior to the de-pegging was a coincidence? Keeps me up at night.
Why is JFK bubbling up all over the news as PMs come roaring back?
GL
dang, I typed my reply in an old browser session and hit post and all got deleted – a second try UGH!
I was not in my adult years at the time of the assassination and cannot speak to it’s effect on silver, however I do realize it contributed hugely to the rush to real worth. My point was that silver’s rise was due to a flight to value relative to gold because 1) expensive and 2) it was connected to the dollar domestically. I would even venture that gold’s rise in the 60’s was due to pressure from international demand (paying more that the exchange rate). Silver on the other hand was obviously detached from coinage domestically and was in the works prior to JFK’s killing.
visit this chart
https://www.longtermtrends.net/mining-stocks-vs-gold-and-silver/
and scale to begin October 1961 to Sept 1968
Silver popped in January 1962 well before the assassination, this is what I mean by silver ‘smelling out’ value relative to gold (I should have extended my posted chart to include earlier dates). Again, I’m not taking away from the impact the assassination had on silver when in fact many thousands of American’s woke up to the fact their gov’t was not so virtuous.