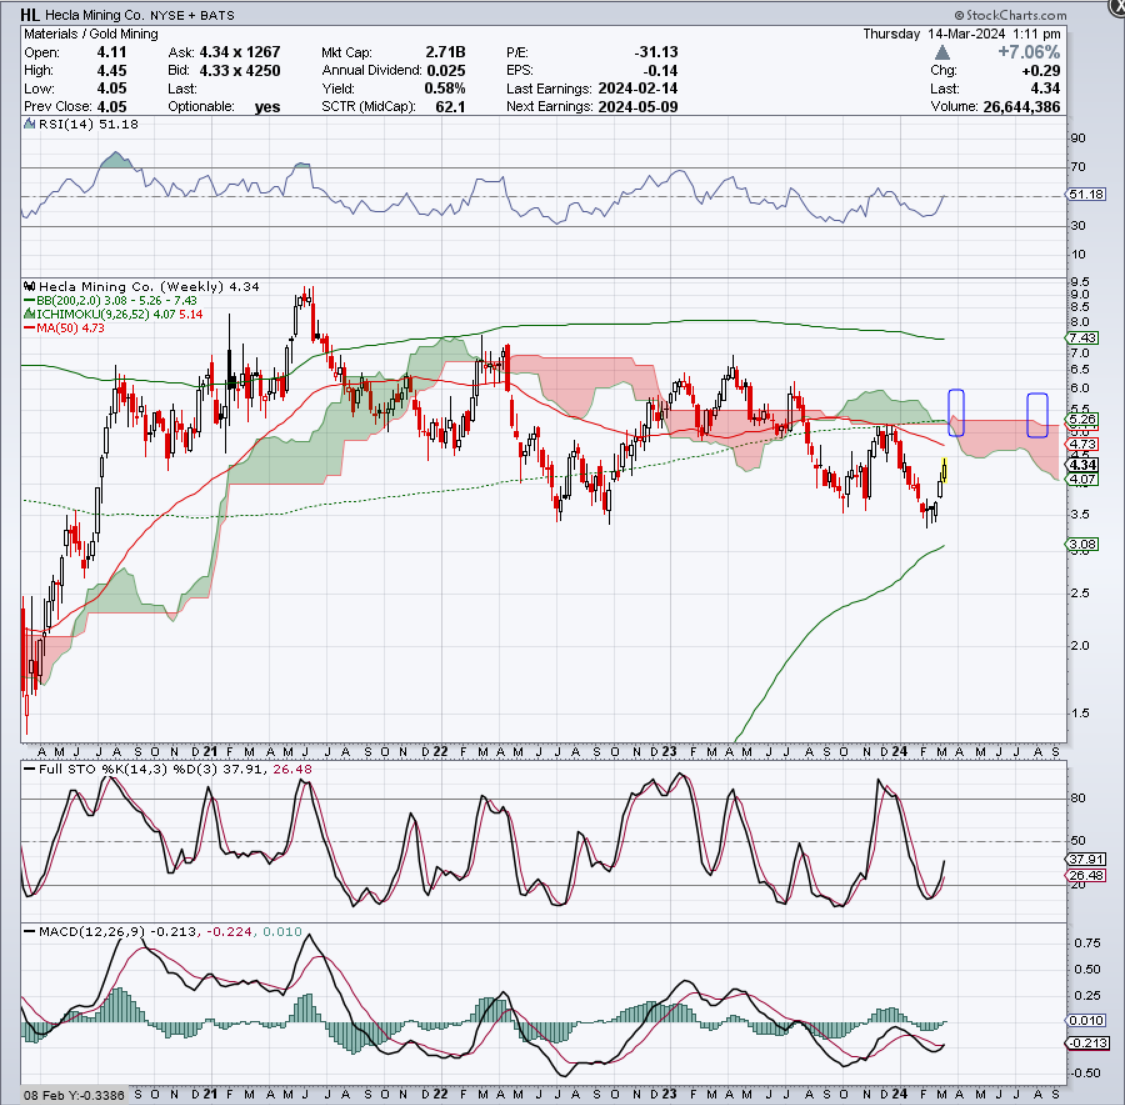
Hecla, a bridge too far?
Maybe I am fixating too much on Ichimoku cloud resistance.
I believe looking at cloud resistance conventionally, HL has two narrow windows to break through the $5.25ish level on the weekly chart–between now and the first week of April and then in July–which I have boxed.
Don’t get me wrong, it is possible for flat Ichimoku cloud borders to get pierced–but it is just not something that you can bet on IMO. Can HL get above $5.25 by July 1st? It needs to tack on about another $1 in 3 weeks, which seems like a very tall order. There was also a gap left behind three weeks ago at the start of the rally, which is a bit bothersome.
On a positive note, HL’s weekly stochastics are still not even remotely overbought and are pointed up and the MACD is on the cusp of crossing strongly positive and is below the zero line.
Also, here’s the TSLA chart from a few years back showing how similar the chart set up is for HL currently. If only….
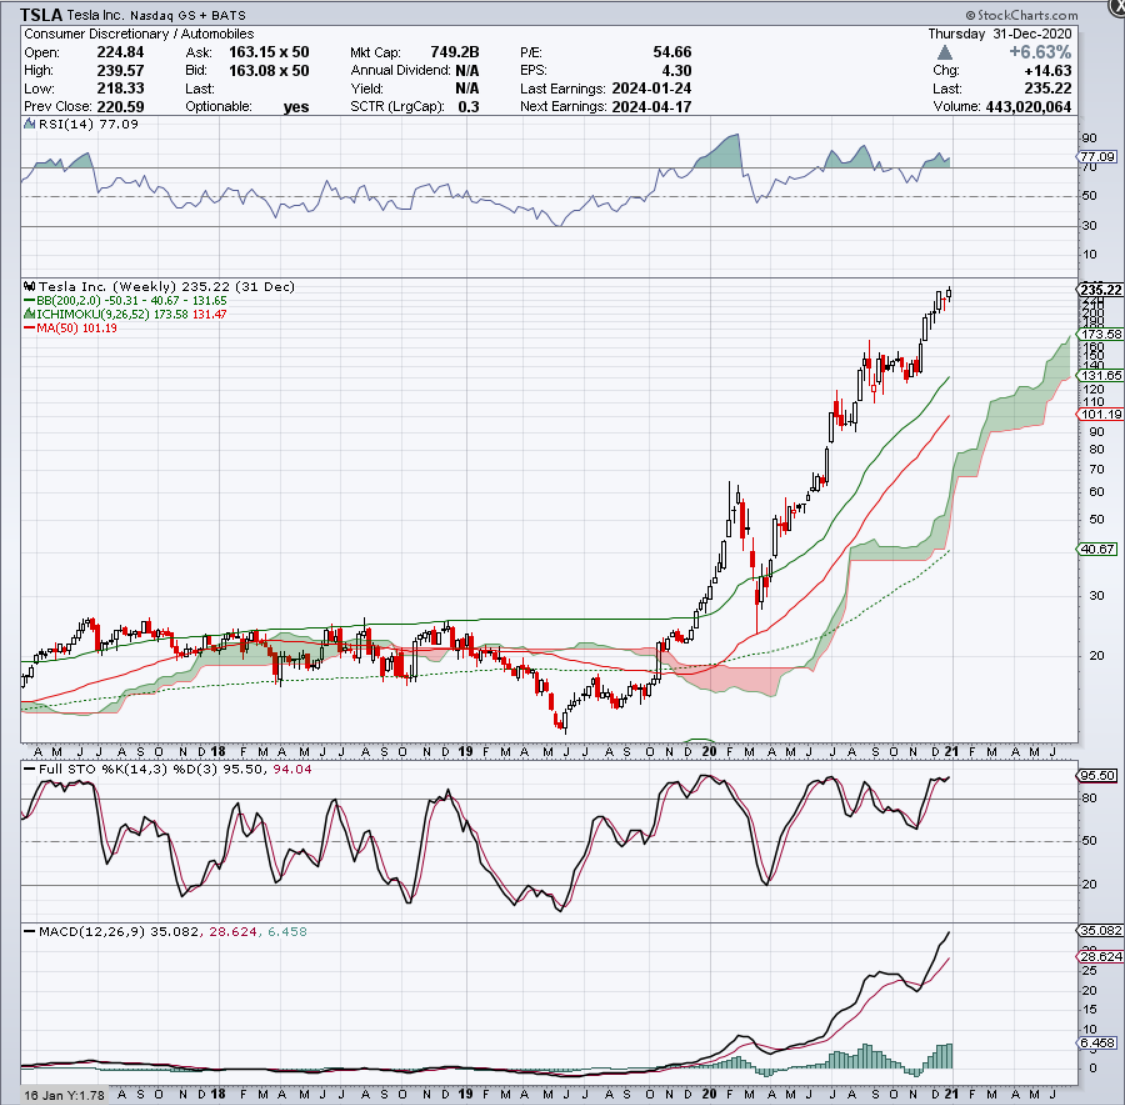
That would be nice