Weekend Report…Gold’s Confirmed Breakout
A Small taste of Rambus Weekend Report
I know the title of this Weekend Report may sound a little bold, but after tracking the 2020 trading range from every imaginable point of view I can say with a strong vote of confidence that the beginning of the next important advance in its secular bull market for Gold, that began at the 2000 low, is underway.
We could still see a backtest to the breakout point, but that would just be part of the breaking out and backtesting process.
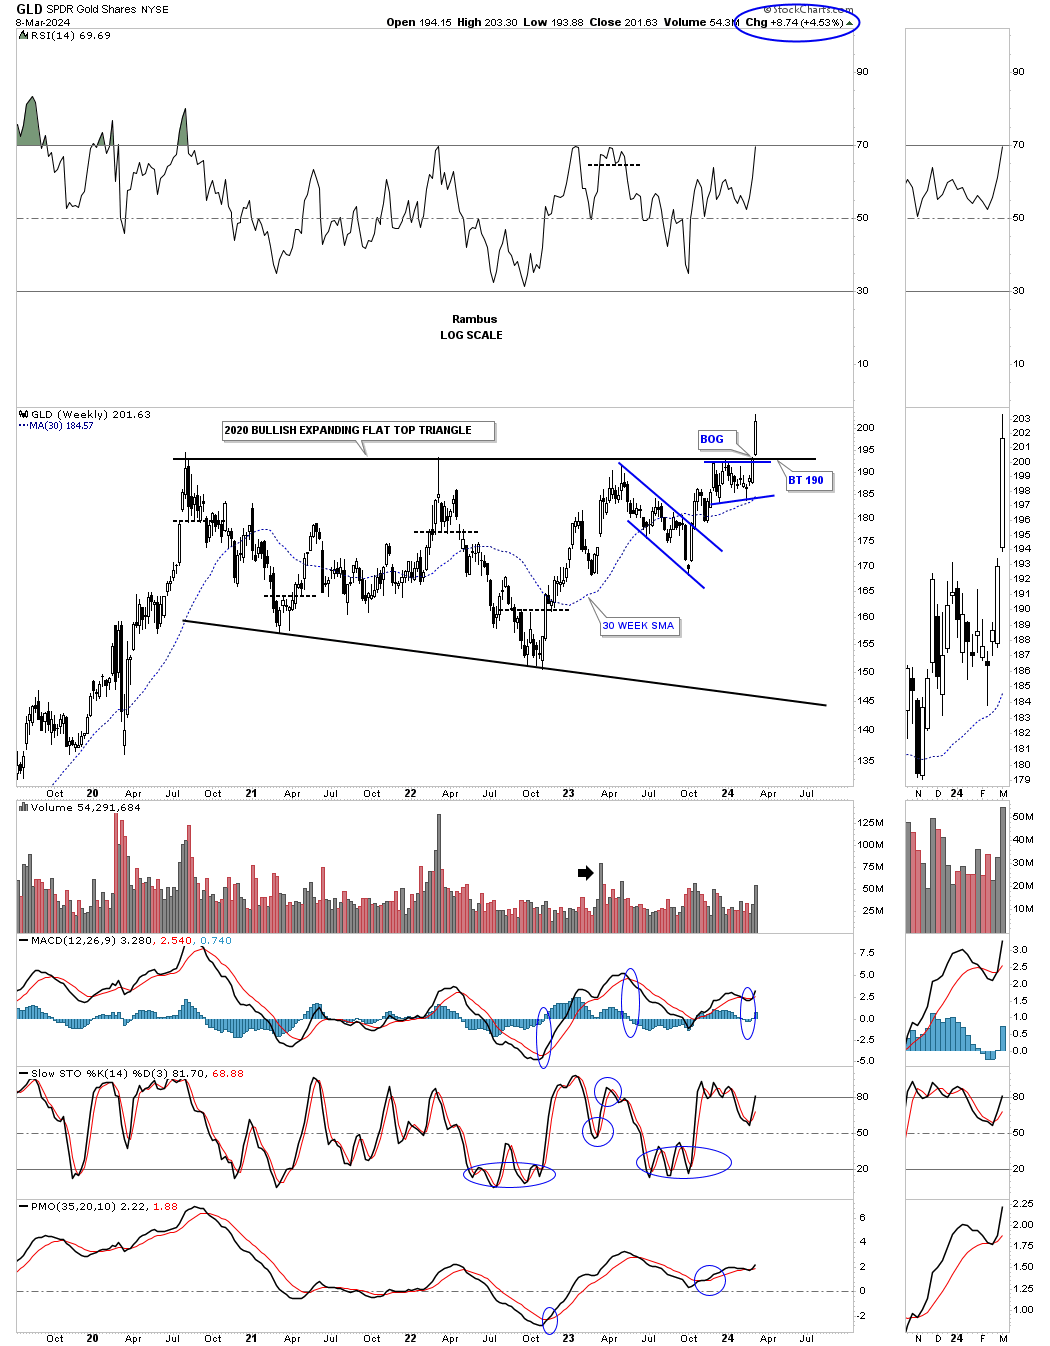
Lets start with the weekly chart for the GLD which shows the 2020 trading range which I’ve labeled as a flat top expanding triangle. This nearly 4 1/2 year consolidation pattern can also be called a cup and handle or a H&S consolidation. At this point it’s just semantics.
Last Monday March 4th you can see the breakout from the 2020 bullish expanding falling wedge. Its a bit hard to see on this long term weekly chart, but if you look at the thumbnail on the right sidebar you can see the breakout gap that occurs on Monday. The top trendline of the 2020 trading range has always been tough to figure out exactly where to draw it, you know one was there, but there were several different ways it could have been drawn. With the breakout gap last Monday there is no doubt on how the top rail can now be applied.
Many more detailed charts for Subscribers in this blockbuster Weekend Report
If you are a Goldophile there is no better Gold Market Technical Analyst on the Planet to help guide you through the twists and turns of next Bull Run . Buckle Up