Bitcoin Last Hurrah?
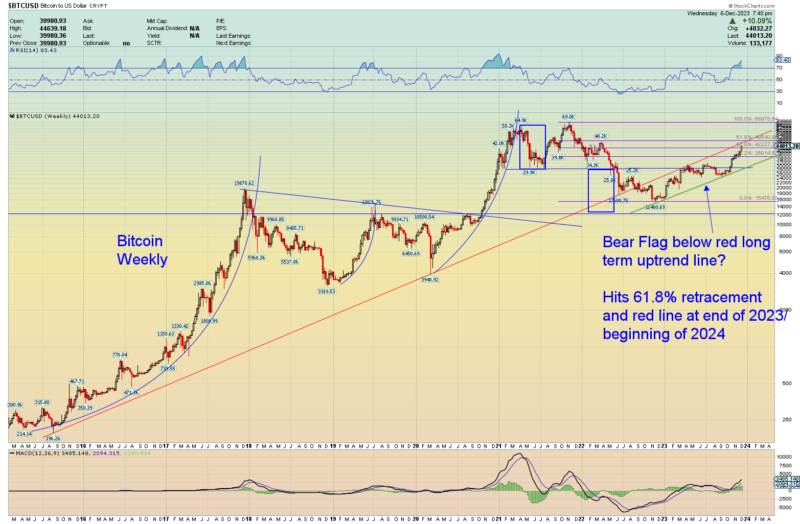
Bitcoin’s long term uptrend line is the red line.
The double top broke down at around $30k.
Then the RED long term uptrend line broke down.
The price then backtested at the double top line and the bottom of the uptrend line around April before moving sideways for a few months.
Now we’re seeing another shot up.
I added the Fibonacci retracements but stockcharts isn’t the most accurate.
The biggestFibonacci retracement is the 61.8% and it is at 48,505 says my other software.
The end of this year, the red long term uptrend line and the 61.8% intersect around $48,505 give or take a few. (Sometimes comes up short or overshoots)
Notice that below the long term uptrend a bear flag could be forming. Green line would be bottom of this possible bear flag.
Could Bitcoin’s last hurrah be now or will those saying Bitcoin $1mill plus be right!?
Good stuff.
My LT charts are VERY OB, but BTC blew thru my last “stop” signal from last month.
Now we’re in territory that says we likely need a double top before we drop, with divergences in the HTFs.
So not straight down anytime soon.
SPX is also now on a Sell (pending EOW), but not a final major sell which looks to late Q1 at the soonest now.
Really nice charting Chuck. I love what you are drawing here. Great style and insights too.
Thank you. Kind words!
Most welcome. You are my favourite chart guy. Hands down, the best at the Tent.