Some T/A Regarding Bonds
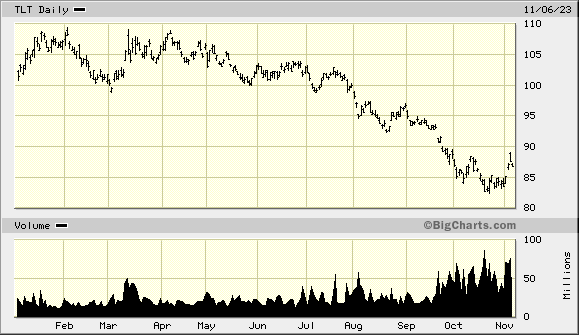 Using the TLT ETF (20Yr US Treasuries) as a proxy, an inverse H&S bottom should be complete by the end of this week. This is a short term pattern and the price objective to enter a position would be a gap fill at 85. The expected target is par or 100. The last time TLT traded at that level of par, representing a 4% yield was on the last trading day of July of this year. The chart would suggest a period of three to four months to reach that price objective, however that is the one variable that is hard to pin down. Not that the TLT is headed to par from here, but rather how long it takes to get there. If one is long and isn’t using leverage, time is on your side. You are earning just under 5% on an annualized basis while waiting for the objective to be reached. If one wants income and thinks inflation is slowing, one might continue to hold the position even after the price objective is reached. That is not my current take but I have no strong opinion at this time regarding how strong or weak the economy and inflation will be past the next few months. I personally would take any profit realized if I bought at 85 and saw 100 in the next 3-4 months. (This is not investment advice, just my opinion.)