“to B” or “not to B” (but to C instead?)
Probably the final chapter for this thread, aside from an epilogue.
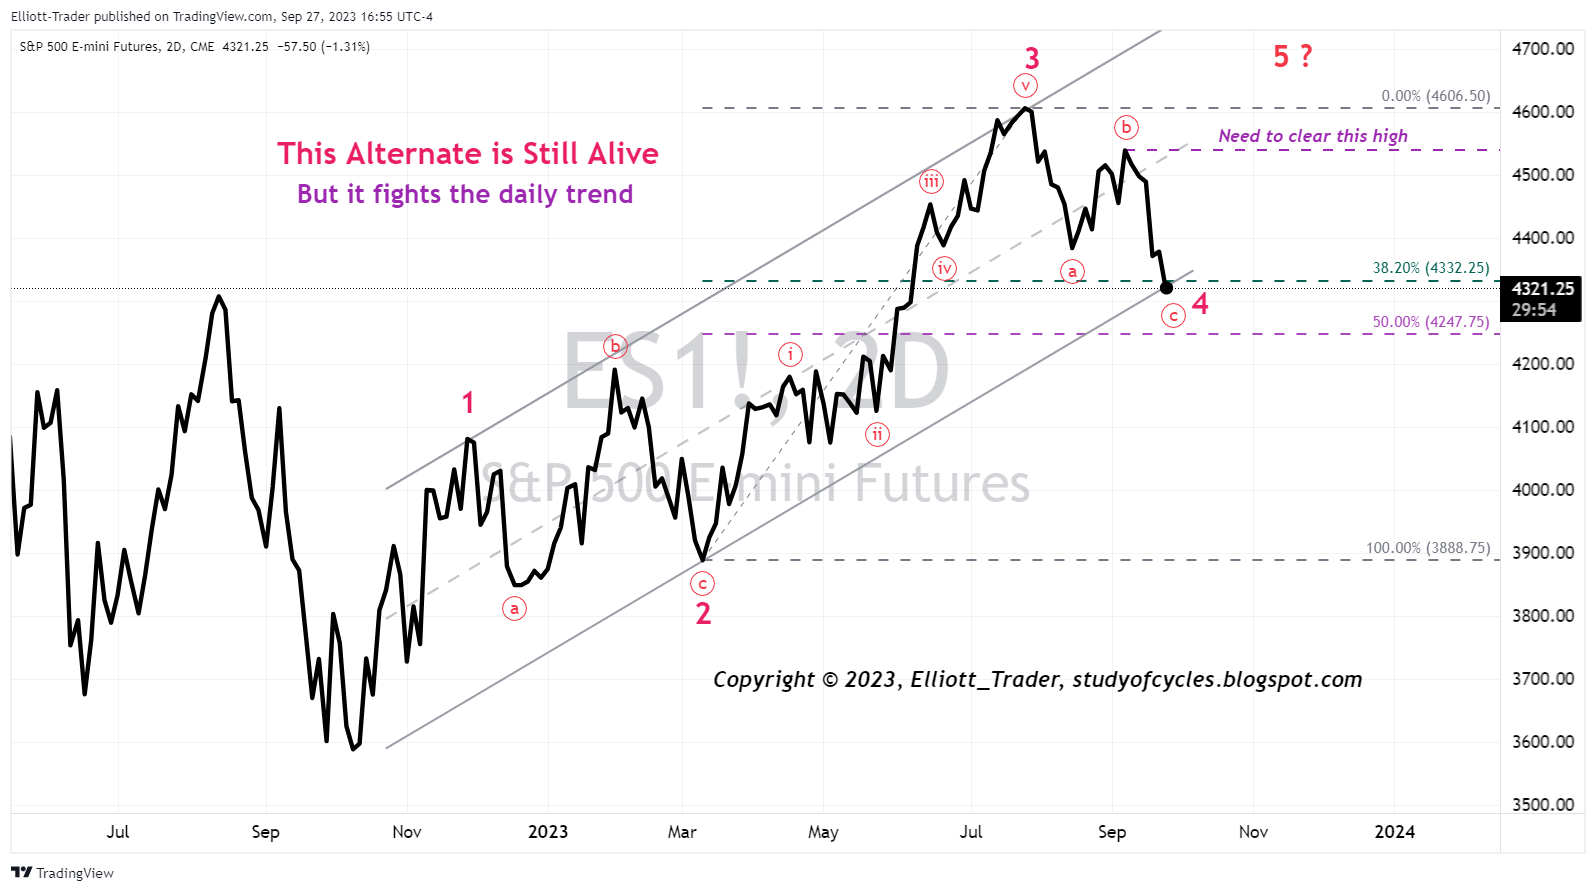
Joe Taverna outlines The Question with this chart.
Do we get the 5th wave up, or does support fail?
(where “B” represents the high for the rally that started a year ago, implied in the chart)
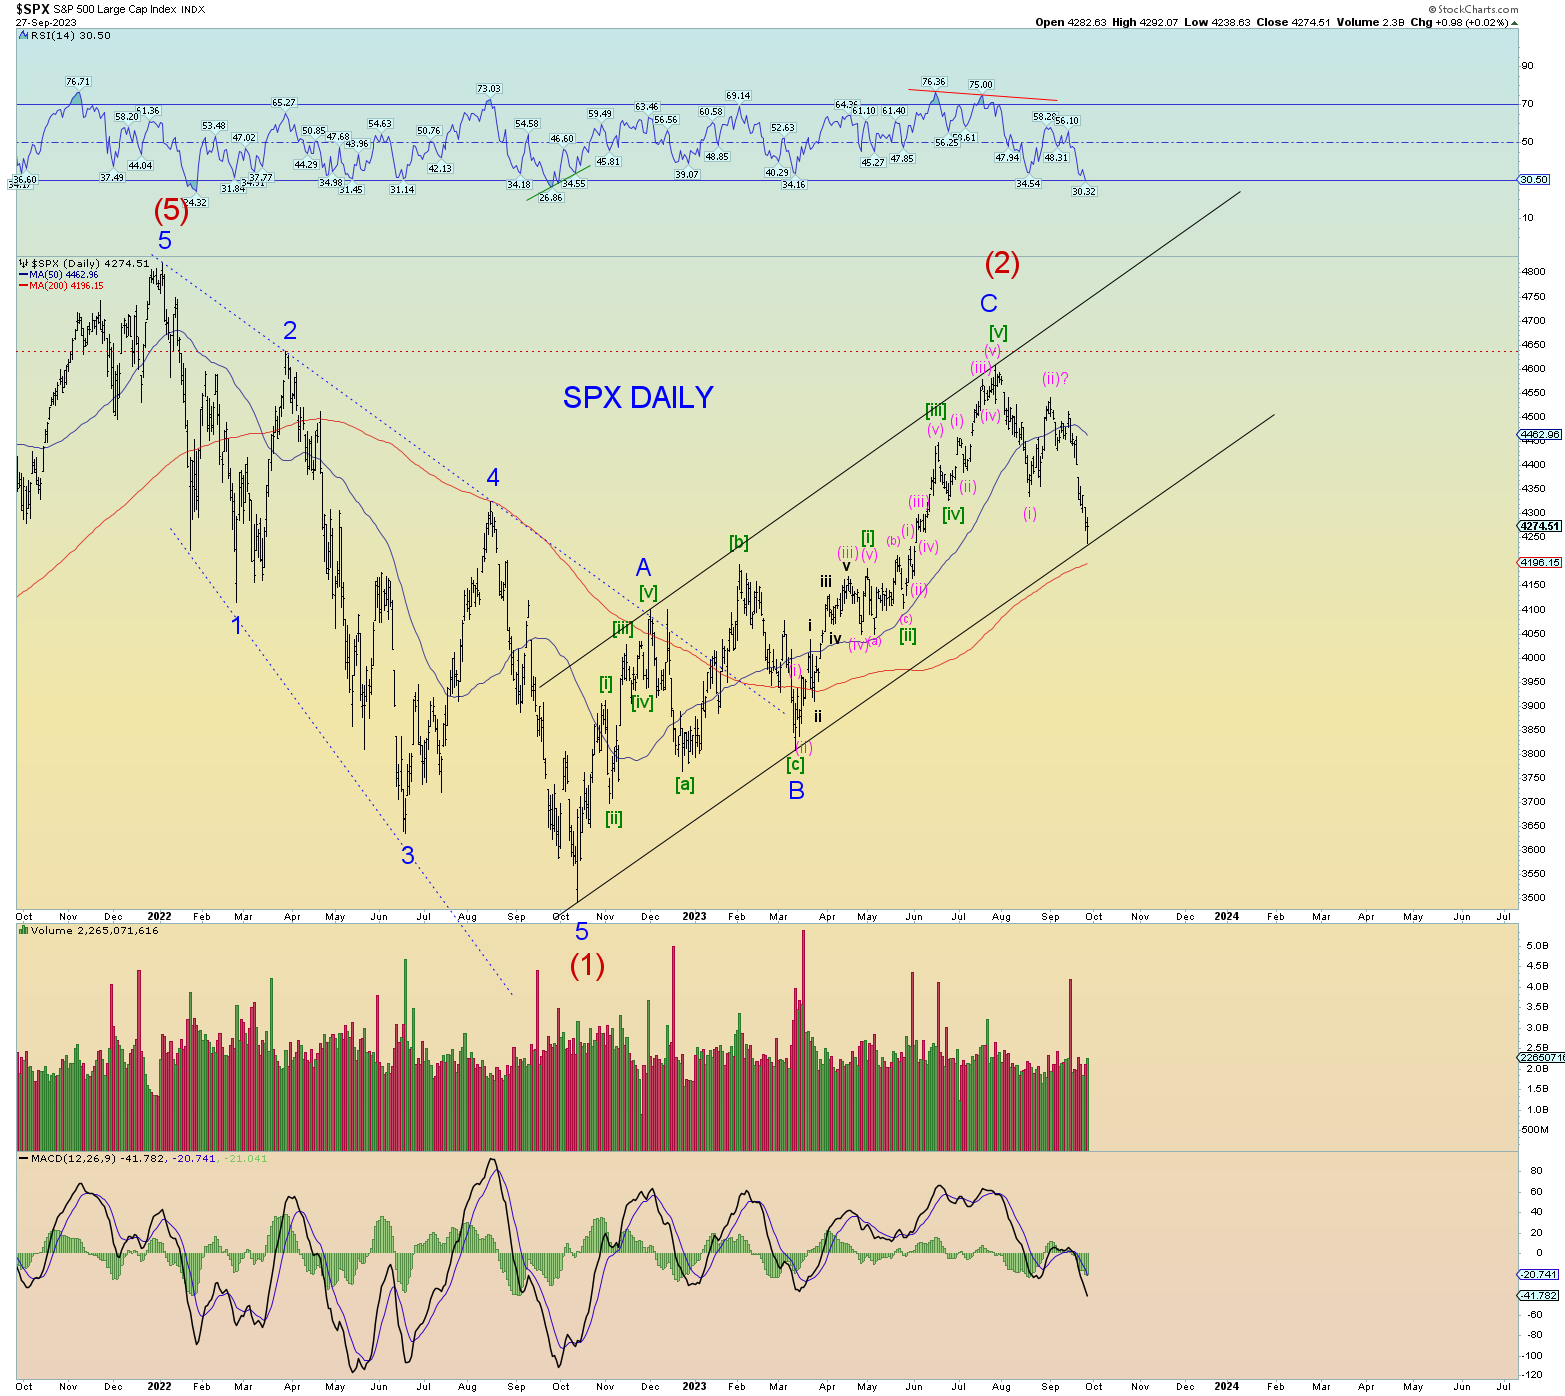
Dan also highlights the major LITS here.
https://danericselliottwaves.org/wp-content/uploads/2023/09/spxdaily-4.png
It would be no surprise therefore to see a bounce here.
BUT … while I’m on SPX bottom watch, I have nothing at ANY degree suggesting its imminent using my own non-EW charts.
So my default is that we’re in large 1 down of the C wave, off the July highs, with a subdivided internal third wave. Meaning, two sets of 4,5s into the bottom for this initial large wave down (1 of 5 waves in total) of C.
UPDATE … rally off lows cannot be a bullish impulse starting Big 5, by rule, due to corrective decline of “iv” overlapping first wave “i”. More likely abc x abc for double zig zag up to key R at 4340 spx.
Despite selling my puts I think we go lower here. Bonds are very weak…
I think it is just time for some deeper correction.
I do plan to try to re-enter short, if we get some kind of bounce.
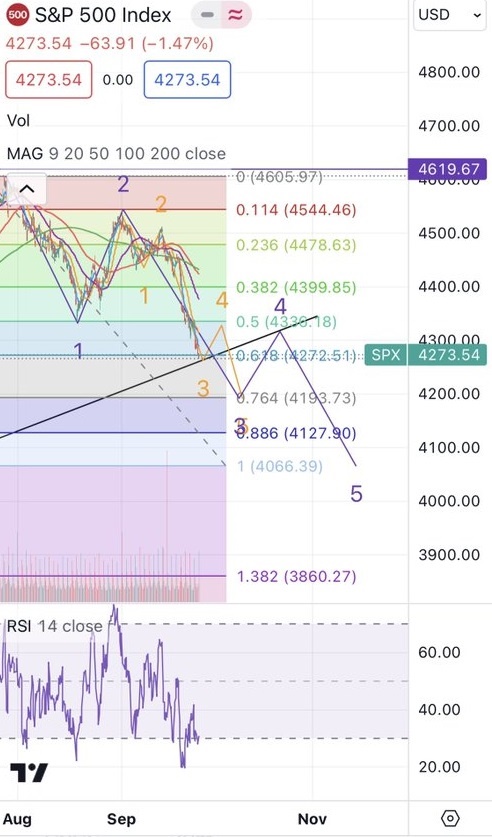
I don’t follow or really understand elliot waves, but the yellow track in the second chart it more or less what i am expecting.
I am very aligned with your thinking Buck! the bounce could be as short lived as just today.
> the bounce could be as short lived as just today
I hope bounce is stronger. Because, if it will be really weak, I will probably miss re-entry. (Well I will probably miss it anyway, I’m terrible trader, I tend to do better sometimes, when I’m positioning for long term holds) Based on past 🙂 Which is probably most likely scenario, I usually regret my dissensions…
Gus, if you don’t mind, I will have one question for you this weekend.
You are in the majority I think. No one gets everything right all the time. For example, so far that bounce looks like it was to close out the day yesterday as future area already showing a red opening bell.
Don’t mind at all, hopefully i have a good answer!
Buck and Gus
Good to have you passionate traders here.
Keep up the dialogue
The Buck and Gus Trading Show
🙂
Target 3000, before this correction is over.