GOLD
Let’s see what happens next 14-30 days. As mentioned in my 07/18-post, I not only stated that 07/28 (last Friday), which easily can be today (Monday), the GOLD (intermediate) CYCLE would TOP but also the possibility that GOLD could ‘tag’ the 2,000-mark.
https://goldtadise.com/?p=587503#comments
When looking at the chart with feed-in from last Friday, it seems that GOLD apparently lives in some meta-versa as Stockcharts marks the inverse-BEAST with 1,999,90 on the chart while in the real world Gold closed approx USD 50 lower.
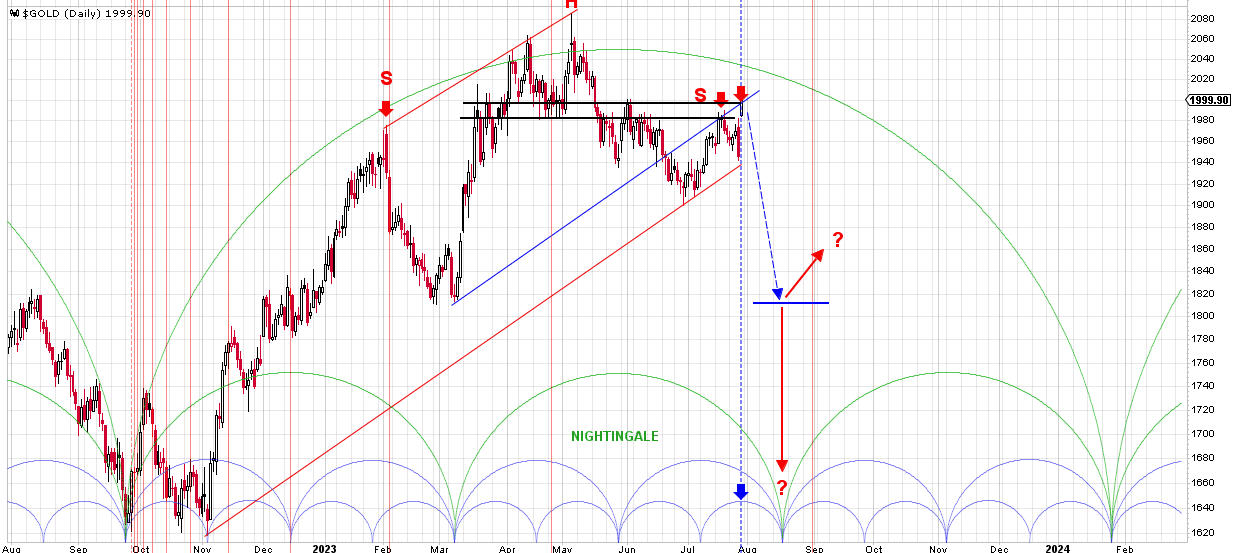
Can you see the precise absurdity? Ofcourse it just a Glitch … or maybe this indeed ‘mark’s a TOP from where ‘the decline for GOLD’ starts in earnest for real which is of course in the paper (gold) meta-verse. Such I am signaling already for some TIME. Nevertheless, this ‘glitch’ on Stockcharts is worth mentioning. Ofcourse such 1,999.90 mark (for GOLD-TOP) has no parallel meaning when SPX made a CRASH-LOW in the 2008-crash marking 666.
As for charted cycles … the FORCE of the CYCLES (for Gold) are NOW set for TRIPLE-CYCLE into a LOW for the next 14-30 days. Such means that a decline can be at a larger decree. Interesting how SILJ-SIL and PAAS for that matter are aligned (see former posts).
Simply put … buying opportunities are about to come.
IMO. DYODD.
Thanks for the analysis.