USD
Here 12-month daily chart for $USD. There is a Channel when taken from September-2022-High. Observe a BLUE parallel Channel which can become a BLUE BULL FLAG once USD BO-UP and above 102.5-ish equal to dMA(50). As for last week, USD completed a Horizontal BT from below and gives a bearish USD-view.
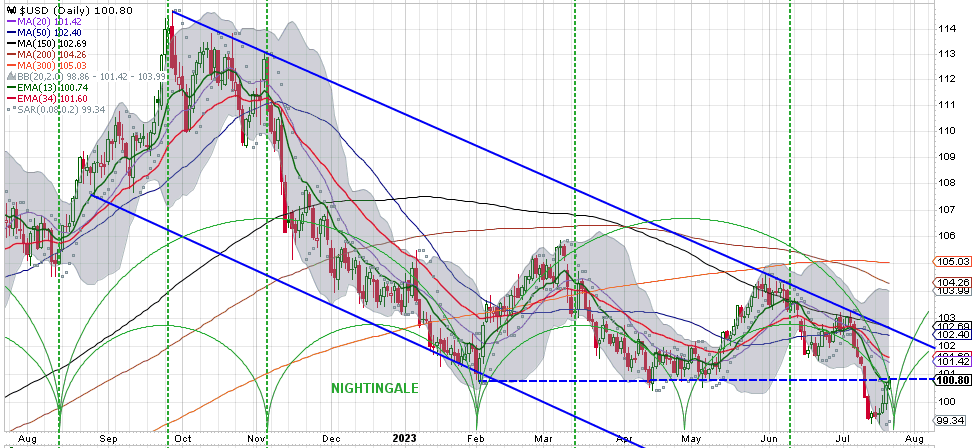
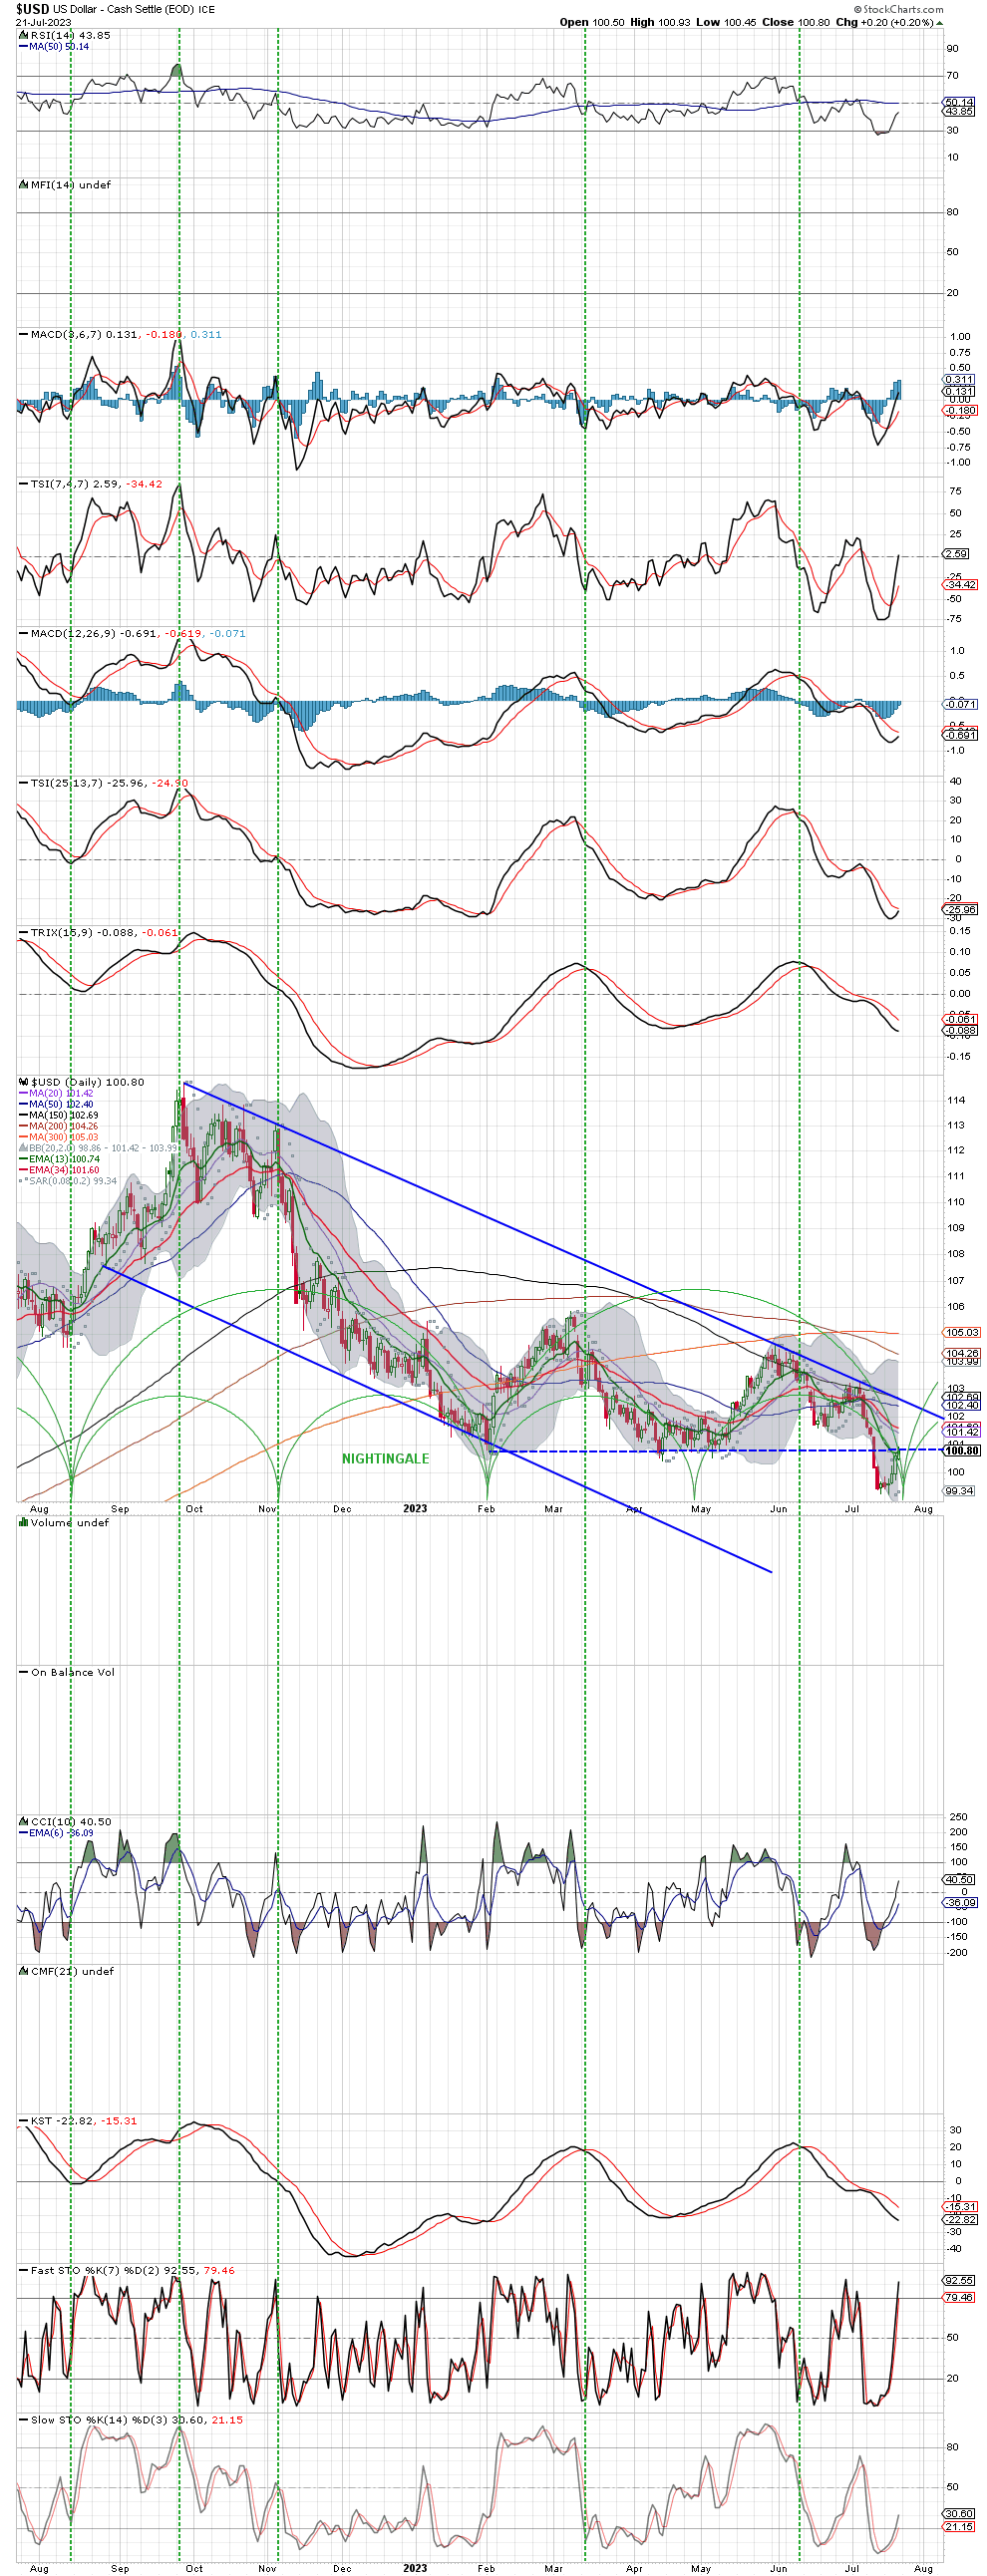
Next week will be interesting for USD. Observe GREEN charted CYCLES which have a few days wiggle room (either back or forth in time). As cycles are set for now … USD (intermediate) cycle low comes 07/24 (Monday). So tomorrow USD either backs-off a little (due to the HOR.BT) or GAP over due to New Cycle.
Some GREEN Vertical dashed lines are set for your convenience.
IMO.DYODD.
Lots of things have gone higher in price while the dollar as stayed relatively “high”. The gold price in general doesn’t seem tied to the dollar. So what is actually affected (beside other currencies) by the dollars value?