BINANCE
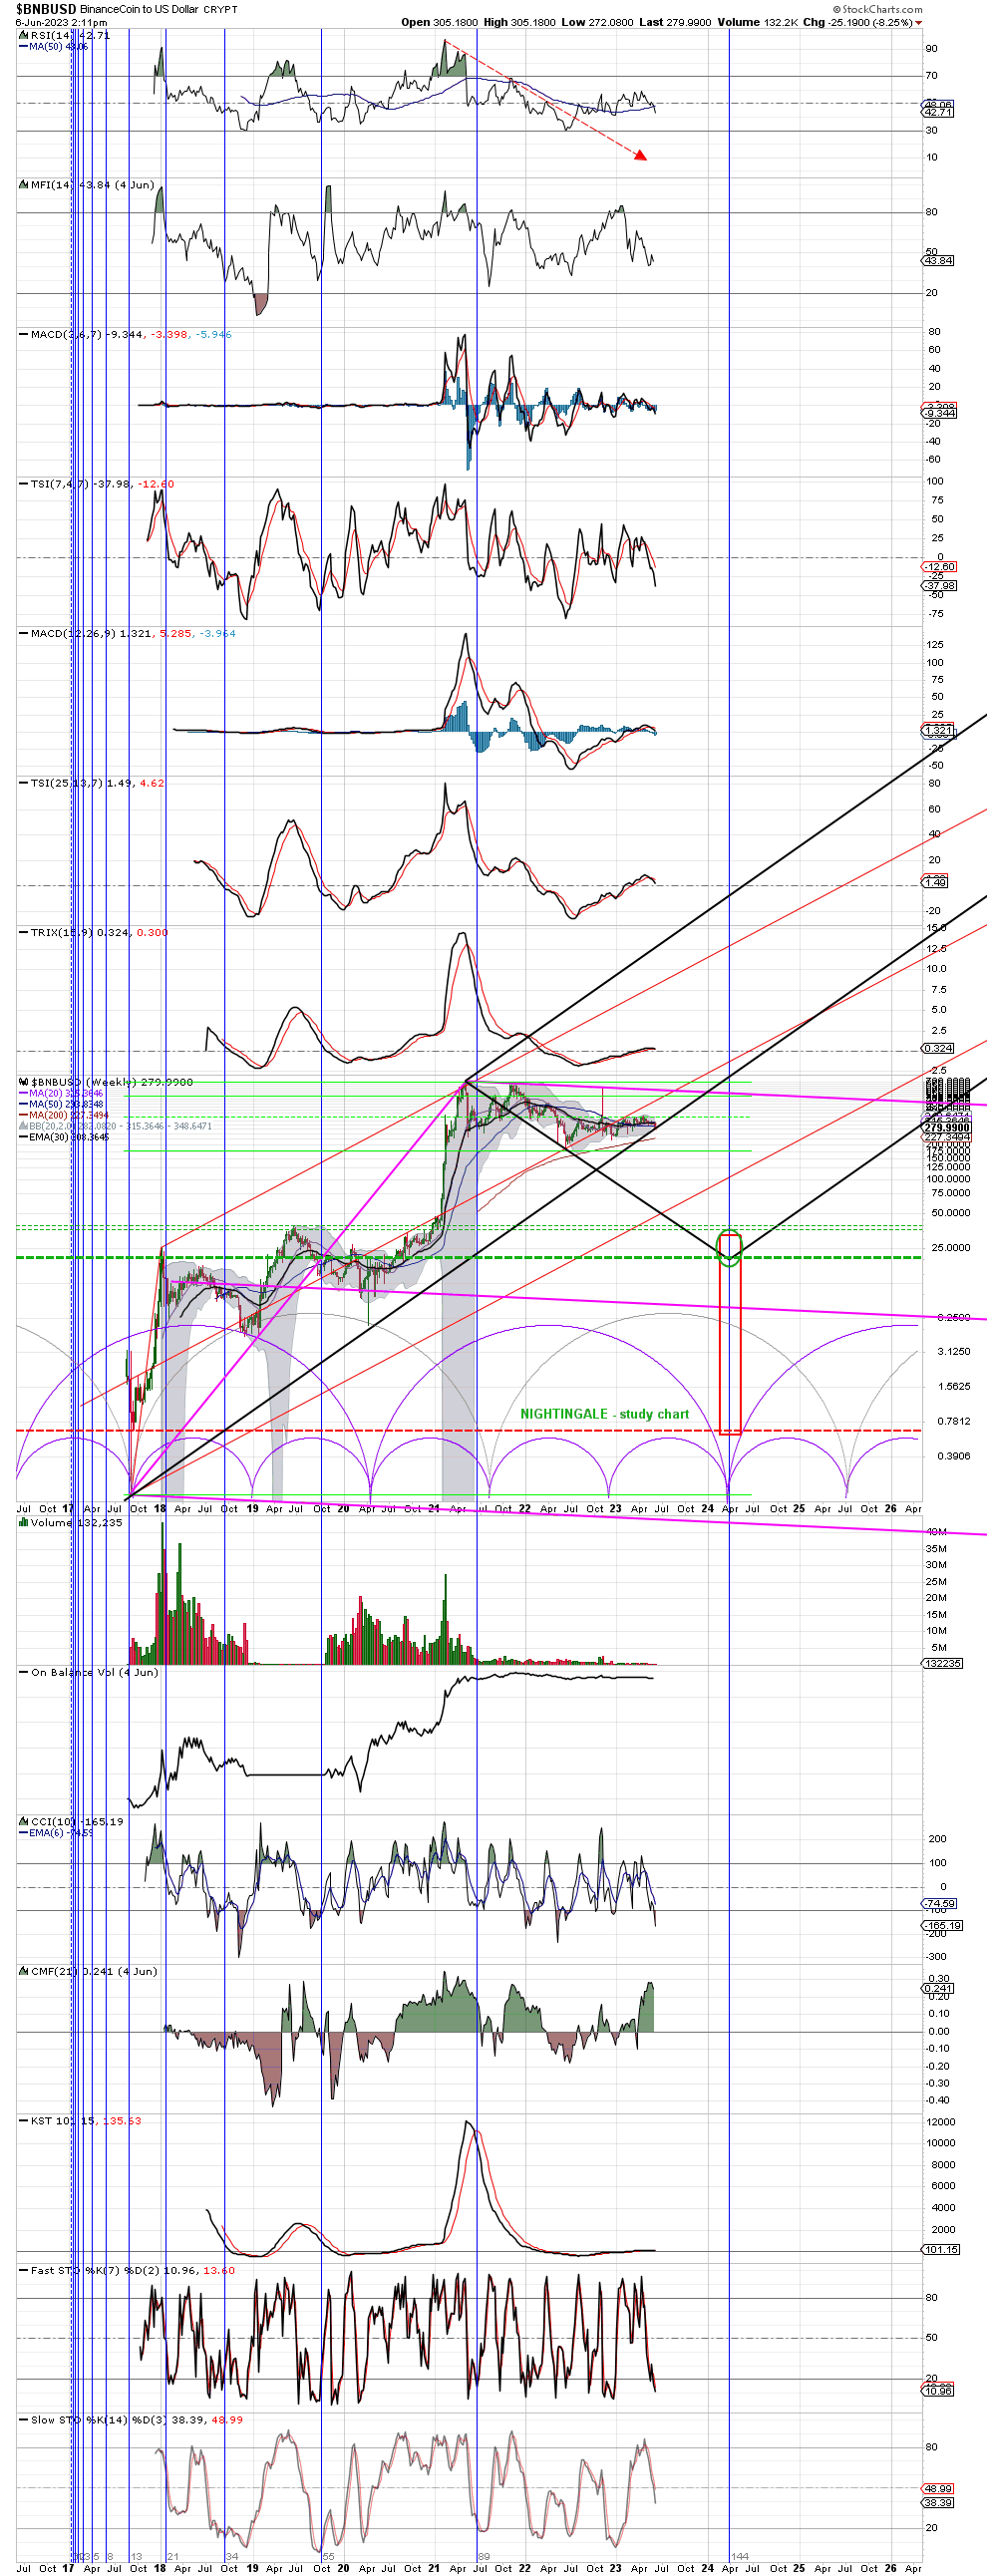
This is a FUN post; not meant for trading. With today’s SEC-news here my STUDY chart for BINANCE which I have not altered. See 6 year weekly chart. For sure Binance made an incredible run making starting from 0.18 making a TOP two year ago (May-2021) @ 686; gaining a multiple of 3,811 x. Such in itself seems unlawful and possibly with Ai all over it; but that aside.
Observe 3 FORKS: PINK, RED and BLACK. As I like predictive charting setting the BLACK FORK along with the potential charted CYCLES. Indicators are rolling-over into negative and price is ‘breaking’ the middle line of the BLACK FORK this week. BINANCE could go as LOW with the RED TARGET BOX on April FOOLS day 2024 with NEXT CYCLE LOW; not joking! If the BLACK FORK is set predictive than BNB-USD potentially goes towards 20-ish. If the SEC-process including delisting is for real than BNB could plunge al the way towards the RED DASHED Support line and who knows the lower PINK line … Andddddddddddd its’ GONE.
Although the RED PO BOX has a Large margin … for me PO is not about price but about TIME (and CYCLES). If price meets/tags an important RES/SUP-line at forecasted CYCLE/TIME than probability for taking such trade is high.
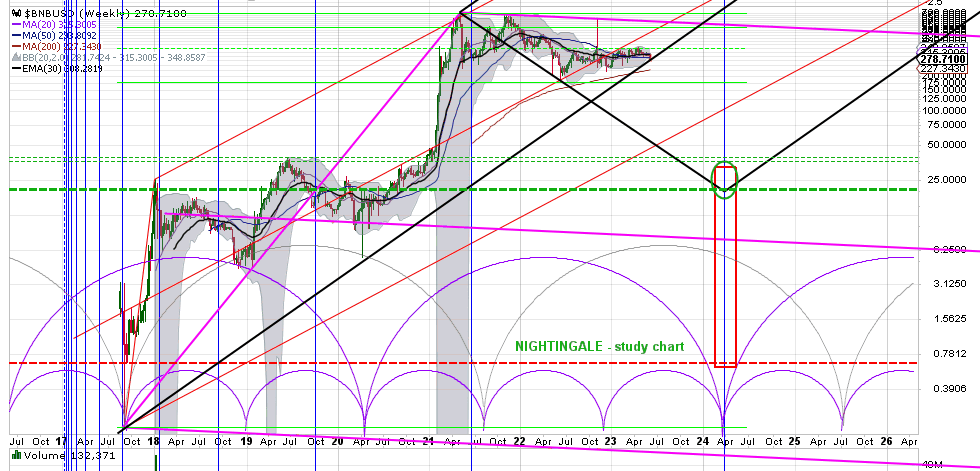
This is a FUN post for the chart fetish; therefore dismiss the many (study) lines.
IMO. DYODD.
Sir Nightingale,
I loved your humor in the phrase “… gaining a multiple of 3,811 x. Such in itself seems unlawful …”
It immediately reminded me of https://en.wikipedia.org/wiki/Extraordinary_Popular_Delusions_and_the_Madness_of_Crowds
But this is where I’m also somewhat delusional.
Having seen a junior go 41X, from my lowest buy point, I’m incline to dream on.
No teasers here. The name is DGMLF.
Cheers,
GL
* inclined * … typo.
GL