Wheaton – The Picture of Rationality
Today I am looking at Wheaton Precious Metals at the request of a site members Peter47 and Hermit who are keen on investing in this Vancouver based company during the coming metals bull market. My first order of business is usually to start with a long term chart to get my bearings and try to judge what’s happening under the hood with price. So when I started digging into the monthly chart yesterday I had a pleasant surprise.
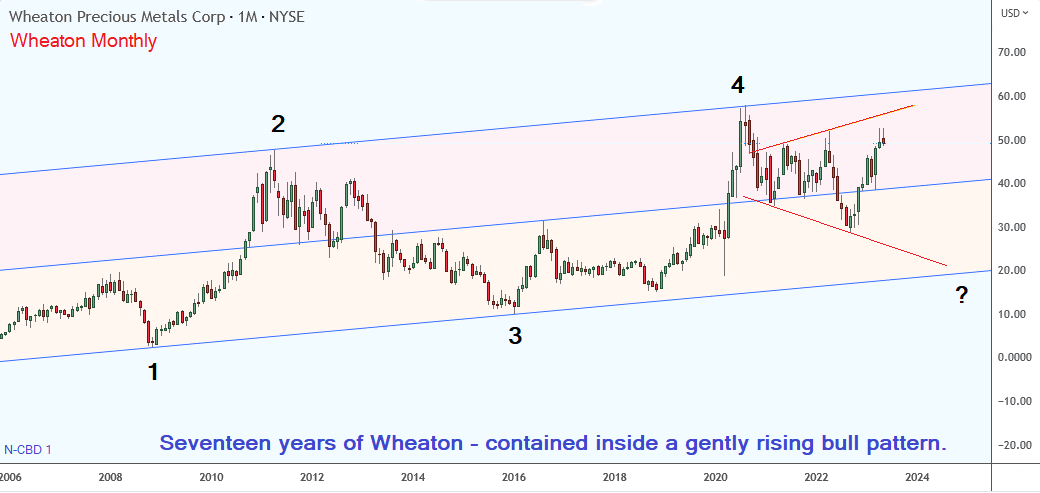
Wheaton is the very picture of rationality!
This is a great chart for new gold traders to learn from. It displays very nice characteristics of cycle lengths, time spacing and price containment all at once. We so often hear the accusations of price manipulation in gold and silver futures and based on those remarks we should surely expect to see the signs also showing up in miners stock price data.
Yet that is not what I see here at all. Wheaton over a 17 year period of time is in a gentle consistent rising bull trend and price has clearly respected both the resistance and support levels as well as the median 50% midpoint line. Peaks and valleys are roughly spaced apart equally. There is no crazed drama markers or irrational price moves that are readily evident (as we see with Bitcoin as one example). On the contrary, Wheaton is behaving like a large well managed company with a great future. If you are patient and buy at the right time your upside opportunity is excellent.
The year 2020 was clearly a banner for these shares. Share prices rose from near the bottom of the channel over a five month period then stopped dead in their tracks when they hit overhead resistance late that same year. Since then it has been consolidating sideways to down and I have noted a clear expanding wedge pattern that has developed and remains unfinished.
The second chart below this one takes a closer look at the pattern to help us sort out whether to buy, sell or avoid this stock for the time being. What new traders should keep in mind is that no matter how much shouting comes from the pulpit about the death of the dollar, it still matters where and when you buy your precious metals shares. Just look at where we are in the cycle and ask yourself what the odds favour before pulling the trigger.
This monthly chart is still trending on the high side and above the 50% line with a clear path lower based on the channel and RSI (not shown). Maybe the the dollar is dying….maybe not. Whatever is happening, Wheatons price chart is telling us to take a deep breathe and just relax a little because it’s going to fall back alongside gold in spite of the sounds of panic in the voices of some dollar sellers in the crowd. Whew! Thank Goodness for that. LOL
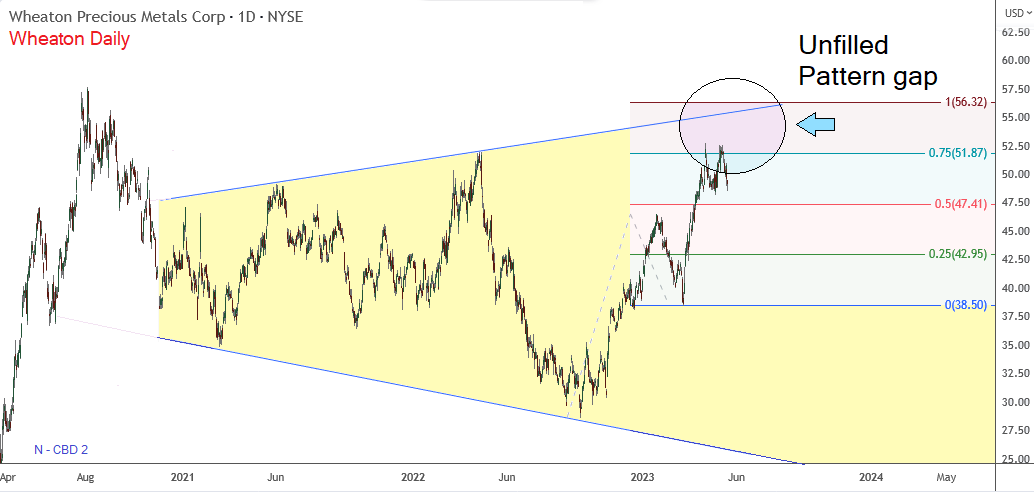
Getting to the second of the two charts. This is daily bars and its the close-up view of the expanding wedge I noted above. What I want to point out here is that price has not yet reached the top of the pattern. An incomplete gap remains to be filled. So if you were planning on buying Puts based on the monthly chart you might want to reconsider as some upside work remains before Wheaton embarks on the decline side of the pattern.
Take a close look at the horizontal Gartley lines as well. We would expect price to reach the 100% level under most circumstances (but not necessarily always). The 100% line at 56.32 more or less aligns with the upper resistance level which is a helpful piece of secondary evidence. So we have two methods suggesting price will yet fill that pattern gap. And that is what we should watch during the remainder of this month and during June. Provided price does not break out to the upside and break through the channel resistance line we should anticipate that Wheaton’s share price will embark on the declining part of the cycle after the gap is closed. There is nothing unexpected happening here though. And no reason to be alarmed by a well anticipated price decline as you can readily see by the prior pattern of the rise and fall of prices.
Therefore plan your next entry trades with the cycle length as your guide and at a price that makes sense within the existing pattern and you should do very well indeed. All the best to everyone and I hope this has been helpful.
I appreciate the chart also. Notably for the clear channel.
Not sure what the numbering signifies, probably just for reference points.
Not for EW, that’s immediately apparent.
For EW, the chart may not go back far enough to find “0”. But taking this view as the relevant history, one could begin by subtracting 1 from each point (and I’ll append R to signify revised). Immediately, its clear this is not a higher degree impulse because 1R and 4R (wherever it finishes) has already overlapped in this triangle consolidation below 1R’s level. New highs would mean 3R is still in progress and could still change the outlook. In any event, while the chart may appear bullish, EW warns that the sluggish (albeit methodical) and overlapping advance is CORRECTIVE at higher degree. That’s a cautionary observation, not a call to sell.
thanks for your opinion . I own some shares for a while, so you suggest to sell some now since the price will go lower?
Are you saying that after reading my analysis you were still not sure what I was saying? LOL!!! That is amazing! I have finally reached the point in life where I can say anything I want and still be right no matter what at the end of he day. Just like Anthony Fauci…Hahahahaha.
All kidding aside, Wheaton has not reached its high point yet which is 56 and change. I strongly suspect its going there in spite of todays pullback in price so take care before making any big buys or sells. You could exit now to be on the safe side or wait a little longer until price reaches the destination shown on my chart and then sell. Choice is yours. Sorry I can’t really offer specific trading advice though…just suggest my personal thoughts based on the charts as I see them.