GDX
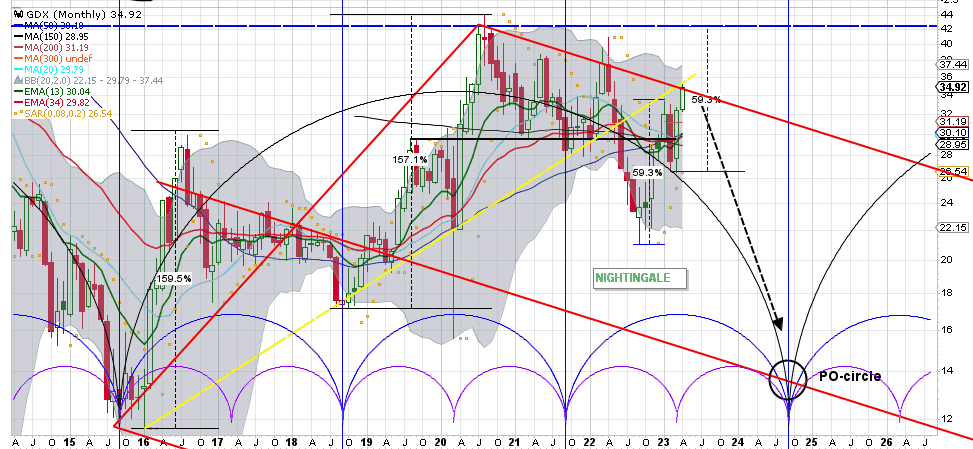
Here 9-year GDX monthly.
The formerly presented GDX-monthly I mentioned a large H&S-pattern of which the little BLACK HOR-line would be the neck but did not work out. So far looks bullish but still needs more work to confirm the BULL.
As for indicators:
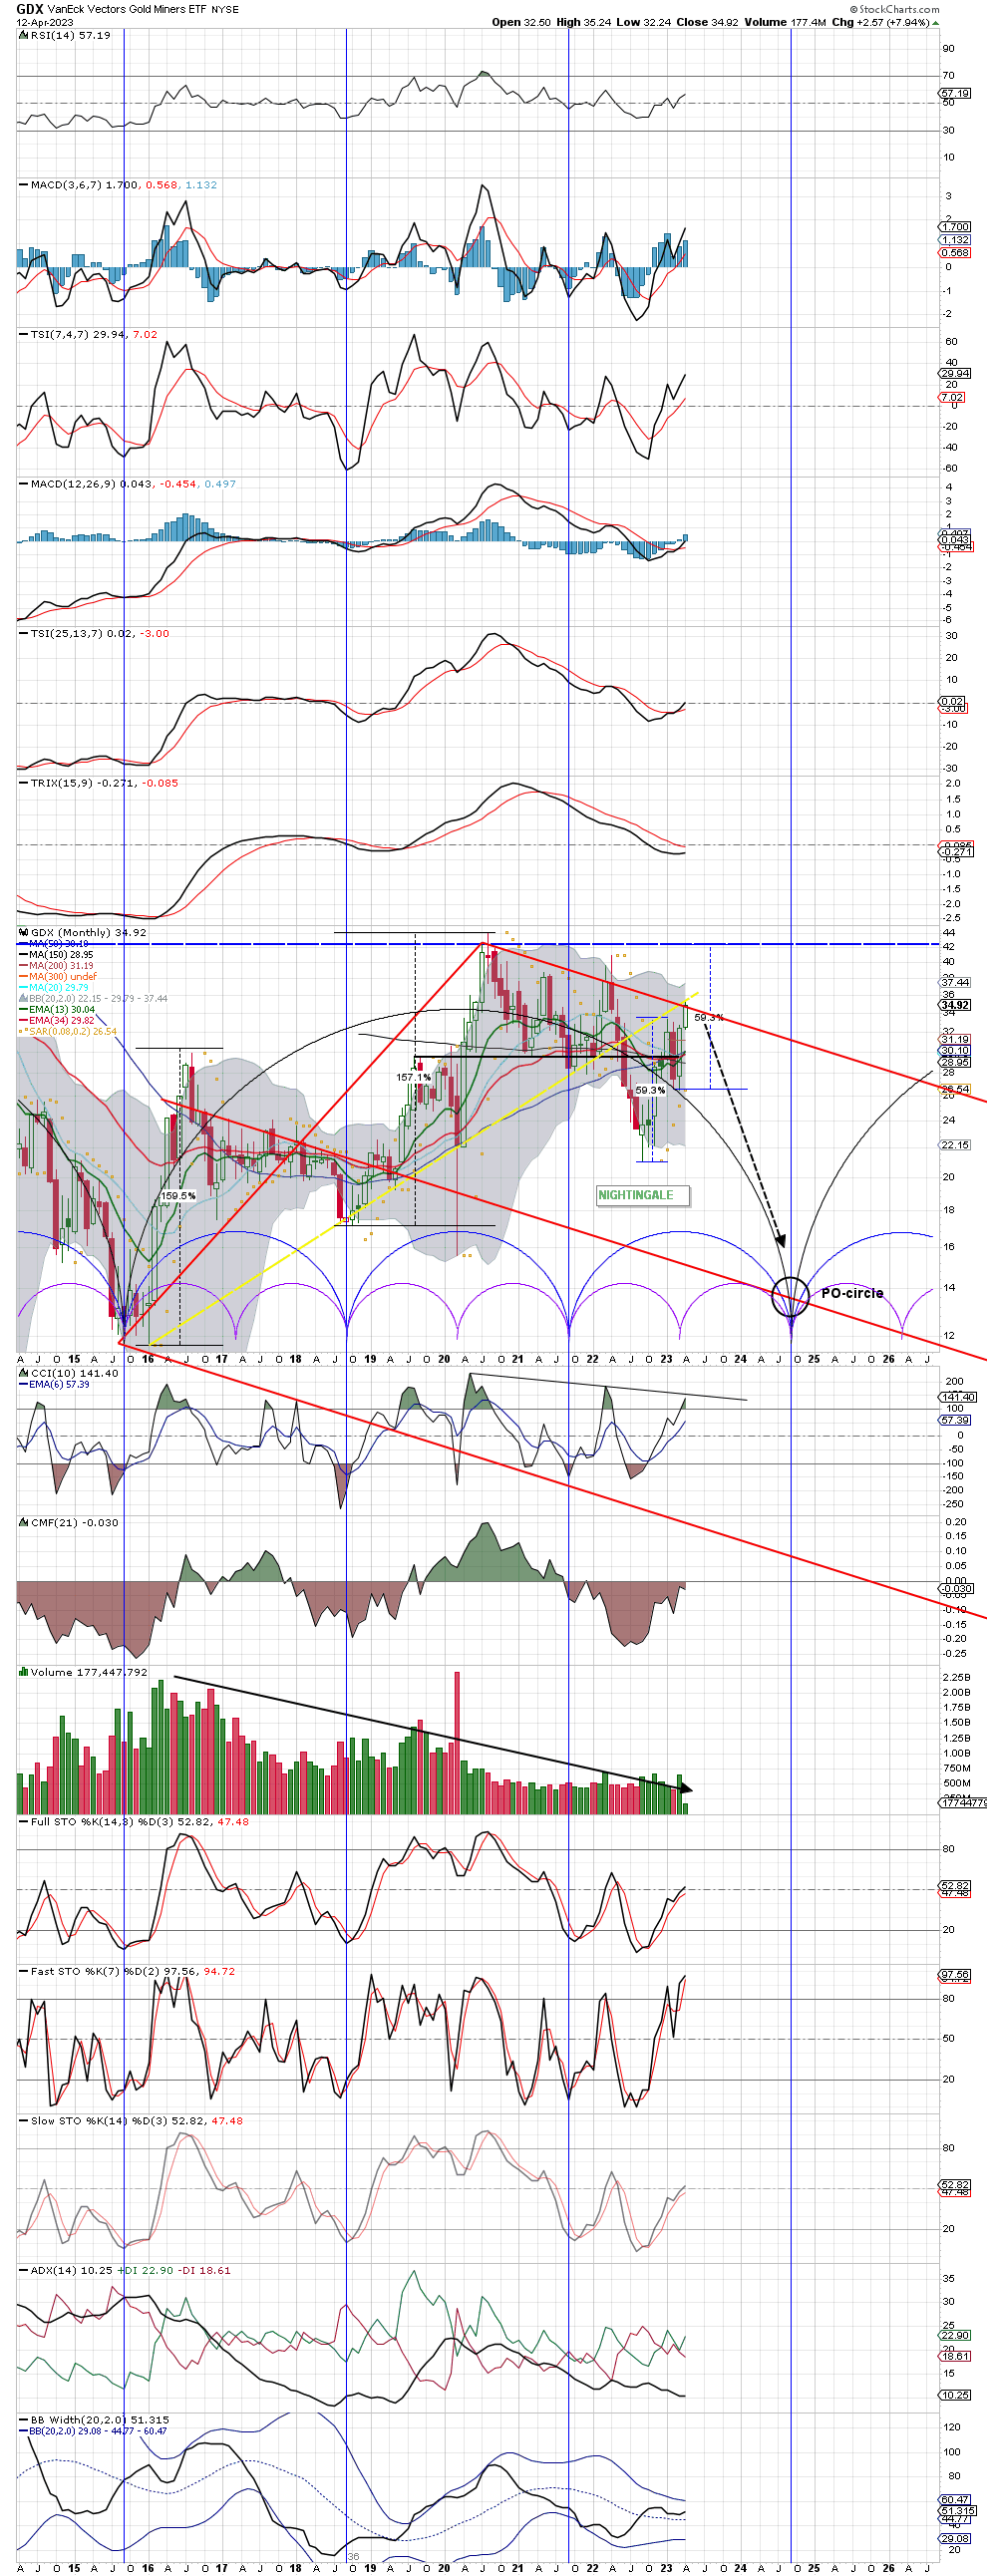
All four TSI horseman are all positively crossed over. The short term-TSI (first two) are above the ZERO-line. The LT-TSI (3rd and 4th TSI) are at cross road and at ZERO-line therefore not confirming the BULL just yet. TRIX should be the confirmation of the BULL but is not only still below ZERO-line and has not (yet) crossed over. Over a span of 9 years VOLUME has been declining steady and not so bullish. While CCI is in the high region and near charted RES, CMF still negative and also not (yet) confirming a BULL while RSI has plenty of room for bulls.
The chart: At a glance it might look busy but (IMO) is highly informative!
Since 2015/216 bottom GDX rallied in a HALFWAY-pattern of each approx. 160% by which 2020 marks the GDX-TOP. From there a New pattern arises but so far difficult to recognize. A medium size (23-42) or large RECTANGLE (42-12) is what it seems as possibility. Since 2020 GDX went side ways in a WHIPSAW. While 2022 looked promising from the start, it BO-DOWN the 2016 YELLOW uptrend line and should be warning #1. Recently (and still since 2022-low), GDX actually is in HARD and DEEP BT-MODE; testing the 2016 uptrend line from below!! And such is where we are today/ this month. Add to this a RED FORK where the handle (2016-2019) makes a perfect fit and marks the FORK-RES this month. For more bullishness … GDX need to over this RES. Such is possible in terms of a little Halfway-pattern (see 2x 59% UP) and if so, then GDX PO would be 42 marking double or triple-TOP.
Nevertheless, as GDX is at multiple RES while indicators not yet confirming the BULL, observe charted CYCLES. The BLUE CYCLES are interesting as taken from 2016-low where 3 BLUE CYCLES makes 1 BLACK CYCLE. The middle BLUE cycles, marks both 2020-LOW and 2020-TOP. This month (+/- 1 month) marks the TOP of the 3rd BLUE CYCLE and is your warning #2. Maybe GDX makes it to 42 while marking the Little PURPLE CYCLE TOP during end-2023. Maybe. Maybe this month GDX marks its’ TOP!
All in ALL . . . charted CYCLES suggest from here GDX declines where the monthly charts marks some bearish notes while the Weekly and daily certainly does not show these. Even though recent rally, my view remains the same and GDX will decline (heavily) for at least and minimum a DB (double bottom @ 14-12) equal as 2016. See BLACK-CIRCLE for PO. As for TIME: next low September-2024.
Certainly you do not like this post and that is why.
IMO.DYODD.
A Lot of work there NG. Thanks for that and thanks for sharing
How do we reconcile this very Bu=earish Scenario with the fact that Gold is making new highs in every currency…soon to include the USD ?
Is you Gold Chart also bearish ?
“As for indicators:”
I like your selections. TSI and TRIX (smoothed) along with volume.
Those or their close cousins are in my toolkit also.