Using Lesser Known Indicators to Trade
Yesterday I mentioned my use of “Bollinger Band Width” as an indicator to assist in entering new trades and I thought maybe it would be helpful to others if I expanded a little on why I use it. The purpose behind using this mostly ignored indicator is that it serves as a quick visual tool to help me avoid entering trades at times the chart is mostly directionless.The BBW shows you that in an instant as its functioning as a hybrid between both a volatility and momentum indicator at once.
During topping and bottoming periods there is typically a period of accumulation or distribution taking place where its unclear if the bulls or bears are in charge. Price begins to swing up and down in smaller less meaningful cycles and no trend is apparent. I don’t think I have to tell anyone here that this is one of the most dangerous times to be trying to make entries since the pointlessness of the movements can just grind you down and waste your energy as every great looking entry quickly reverses and goes against you….only to revert an hour later and become fleetingly profitable again.
You all know what I am talking about because its cost every one of us money at a certain point in our trading careers!
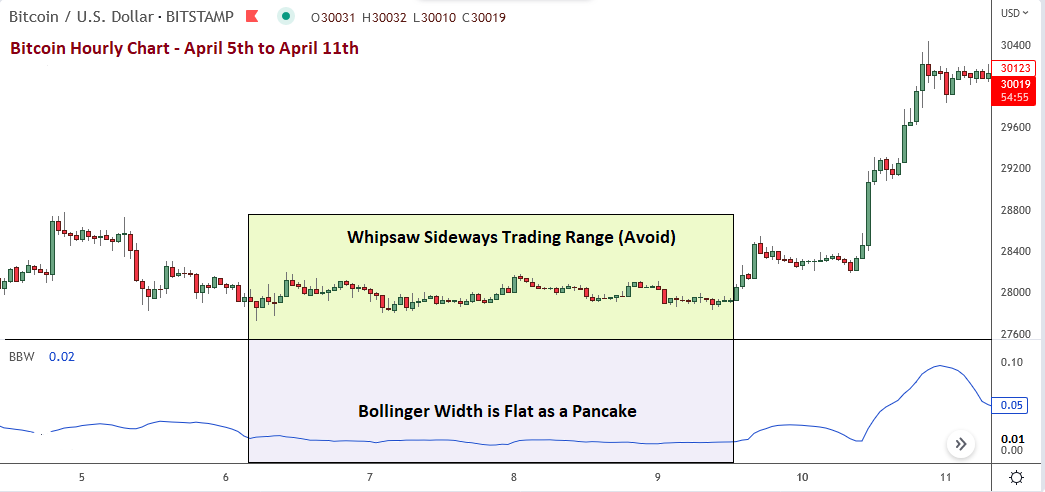
Well that’s where Bollinger Band Width comes in helpful as you can see in the chart below. Whenever width is below 0.01 and flatlining like a pancake you can be sure the corresponding price movements are equally unimpressive and boring. Keep your money in your wallet at such times or look elsewhere for a better trade. In this example the price range went from a low of 27,800 to highs of 28,169 over a three and a half day period of time. Day traders might make money in that confined space but normal humans just get chewed up and spat out because the computer programs gorge on all the profits in those micro-moves which they unquestionably rule. We people need trends to succeed. So that is where we should focus our energy.
As shown, these periods can run for an extended periods of time before resolving themselves. So the indicator is trending at lows as in this example. But it’s not giving an actual buy signal. So don’t use it that way. All you need it for is a quick visual impression of the underlying state of the price action (if it was not already obvious to you). Indeed it is not always obvious to most people. If it were they would not be trying to enter a price lows (or highs) when nothing meaningful was happening under the hood.
At the moment, Bitcoin is trending sideways based on the 15 minute chart (not shown here) when viewing the Bollinger Band Width. It will likely continue to do this until next Monday when the weekly reversal comes into play. So keep that in mind. Making entries now will likely feel very frustrating as the chart goes nowhere and the accumulation/distribution plays out. Unless you have absolute certainty about the next direction, just stay out of this market and let it reveal itself first. The ultimate reversal will depend on aggregate positioning. The chart can invert and shoot skywards in spite of what appears to be a bias suggesting selling is the obvious next trend. But too many shorts will end up creating the opportunity for a squeeze by the big players. So leave the guessing to others and just let it play out for a few more days before making your move.