David Brady Posting –
David Brady has posted his end of year opinion with 2 potential directions for gold :
Either gold is going north from here or it will experience a pull back first. I am positioned for the scenario that there will be a pull back first and I have thus parked money on the sidelines to profit from PM price drop.
I expect that 2023 will be a spectacular year after the initial pullback runs its course.
If you care to read David’s post, I would appreciate feedback about your personal thoughts and strategy for 2023.
Cheers
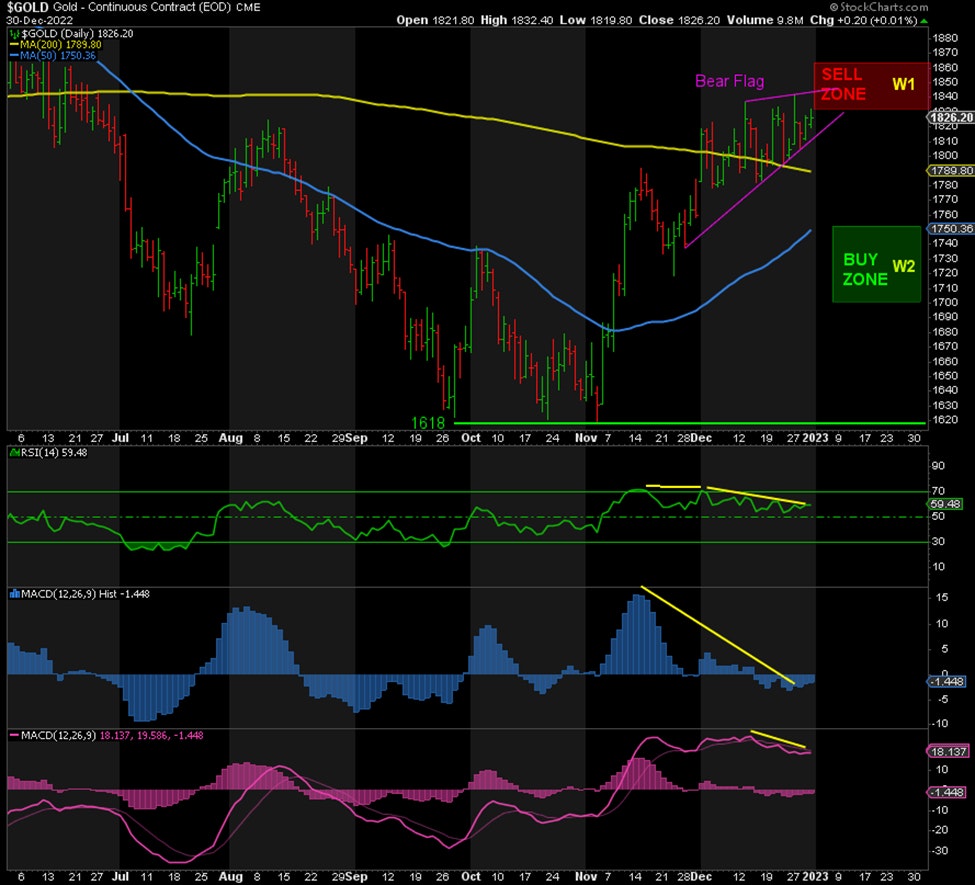
Nothing goes up in a straight line. In Elliott Wave terms, the peak in Wave 1 is “always” followed by Wave 2. Even the gargantuan rally from the low in August 2018 to the new record high in August 2020 had a wave 2 follow wave 1, despite the strength of the initial rally. I don’t see a clear wave 2 reversal anywhere since the rally began in November. This means that it has yet to come.
Gold is also exhibiting a ‘Bear Flag’ pattern. This increases the probability that the next big move is down. It could be a fake breakout to the upside, which would be extremely bearish, or a break down through support current at 1810. This does not rule out a move up to 1860 first. Either way, a higher high first or straight down, we get a pullback
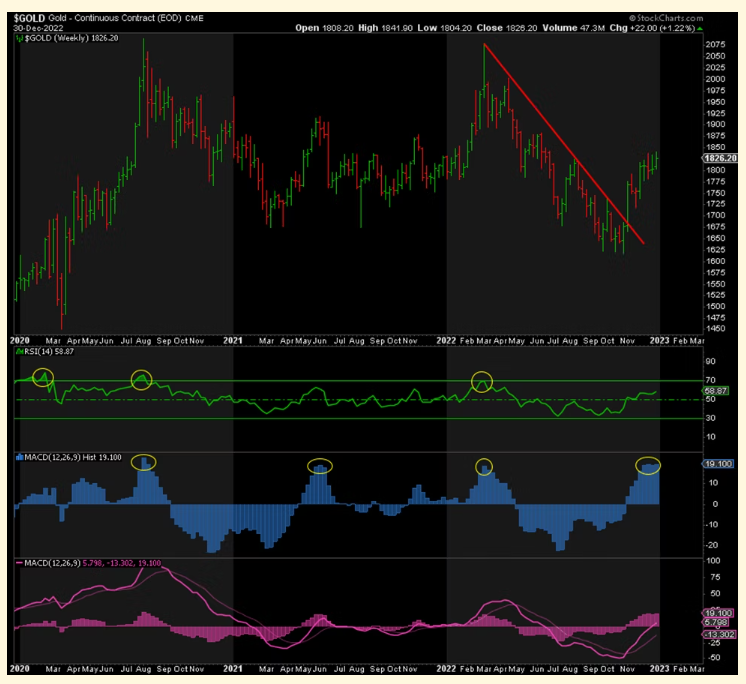
The weekly charts show the breakout to the upside in November. Although the RSI and the MACD Line both show there is plenty of room to the upside before becoming overbought, this just reinforces the coming rally to new highs imho. However, the MACD Histogram has been stuck at elevated levels for weeks, levels which have triggered drops of $250 to $500 three times in the past three years. While I am not expecting such a drop, it is sufficient for a pullback of 100-150.
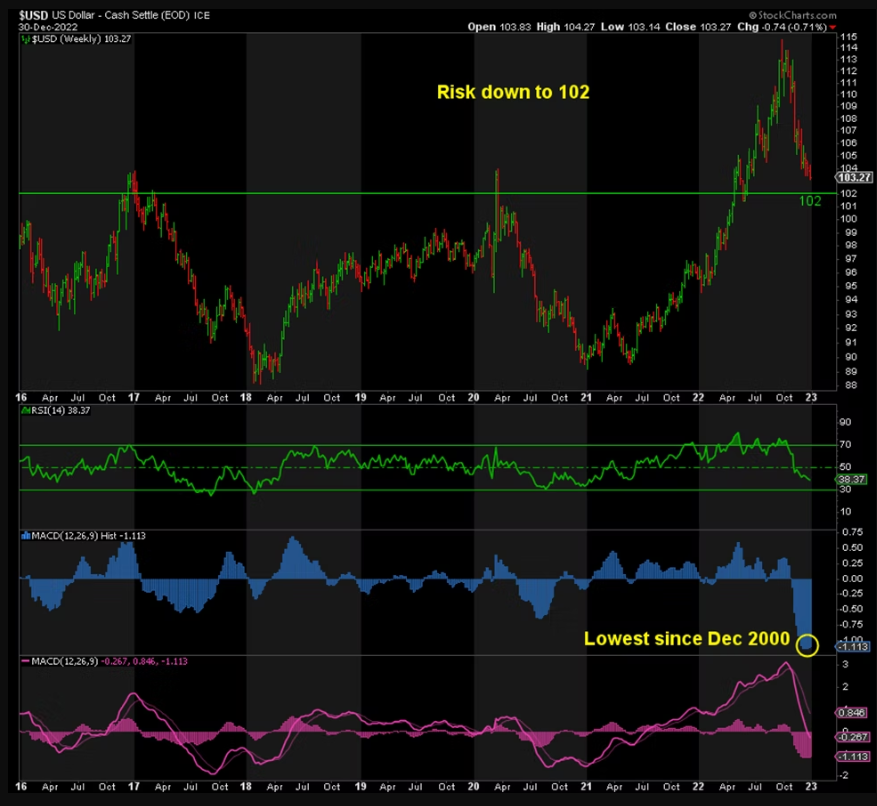
Starting with the weekly chart, we can see that the DXY has fallen over 12 big figures to 103.27 after flirting with support at 104 for the past few weeks. Below there is additional support at 102, the 50% retracement of the entire move up from 89 to 115. While I don’t believe 102 would be the bottom, DXY is overdue for a healthy rebound to 106-110 before it heads lower again. The MACD Histogram is a mirror image of that in Gold. It bottomed out at its lowest level since 2000 and is now turning up, which signals a big bounce is coming.
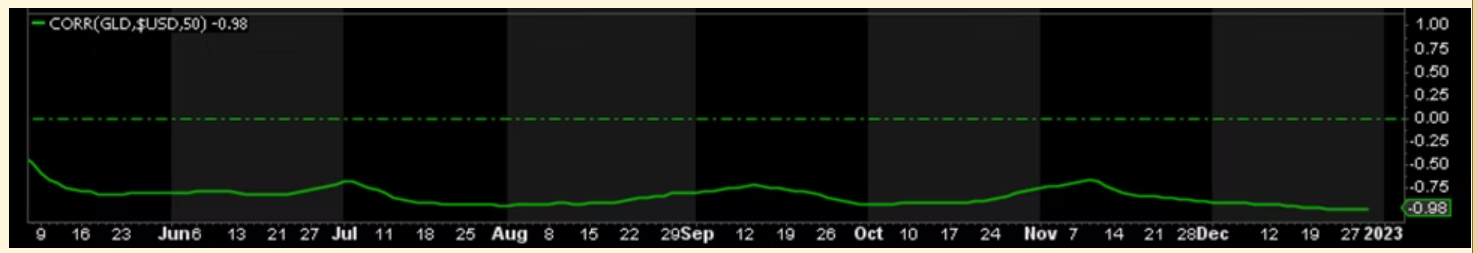
And as long as the near perfect inverse correlation between Gold and the DXY remains in place, a dollar reversal to the upside would clearly weigh on Gold and the rest of the sector.
In summary, the risk to the downside in the DXY is a mere dollar 50, whereas the upside is 2.50-6.50. The risk reward is clearly skewed to the upside, which doesn’t bode well for Gold.
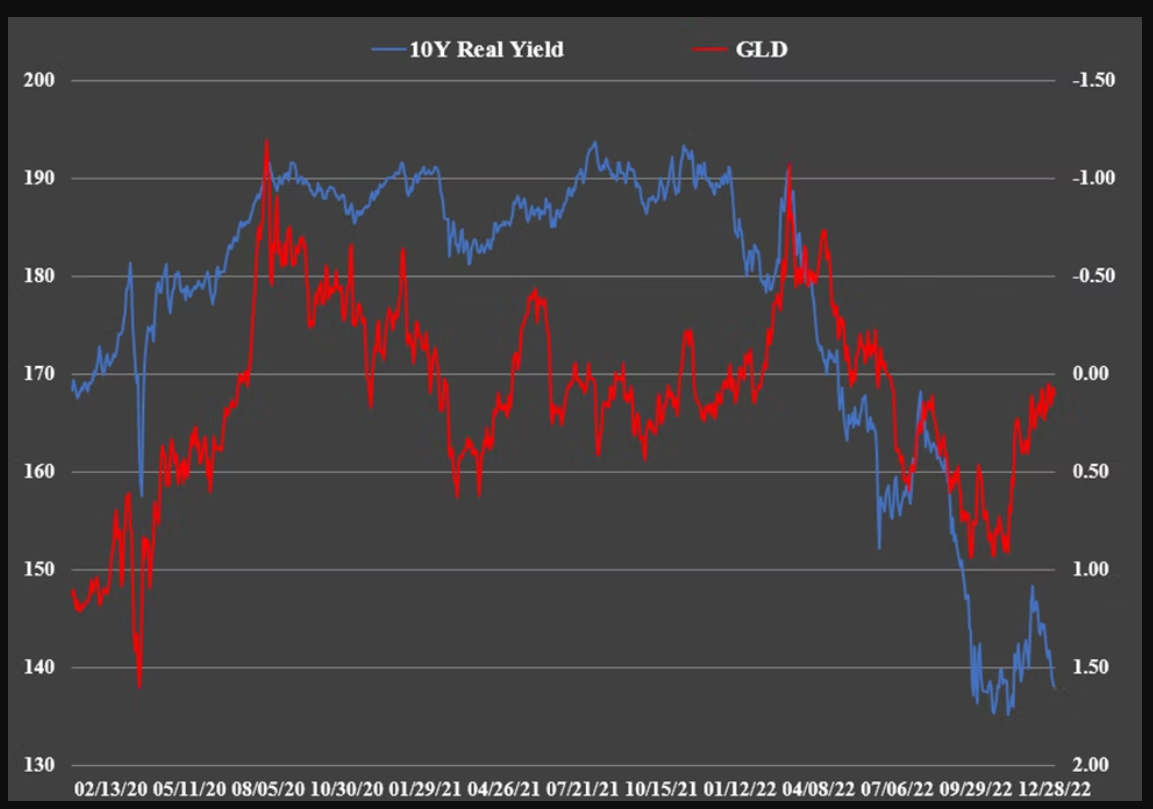
Then there is the 10-Year real yield, the most reliable inter-market factor affecting Gold. When real yields rise, Gold falls, and vice-versa. Well, real yields have been rising again recently while Gold continued to rally. Such breakdowns in their direct relationship typically resolve soon after, which means either Gold or real yields fall, or both. Yet another storm cloud hanging over Gold after a strong rally from 1618.
In conclusion, there are numerous data signals that Gold’s rally is running out of steam and it’s headed lower, including it being the most bullish since the peak in March at 2079. All it takes is a sustained break of 1810.
BULL CASE FOR GOLD
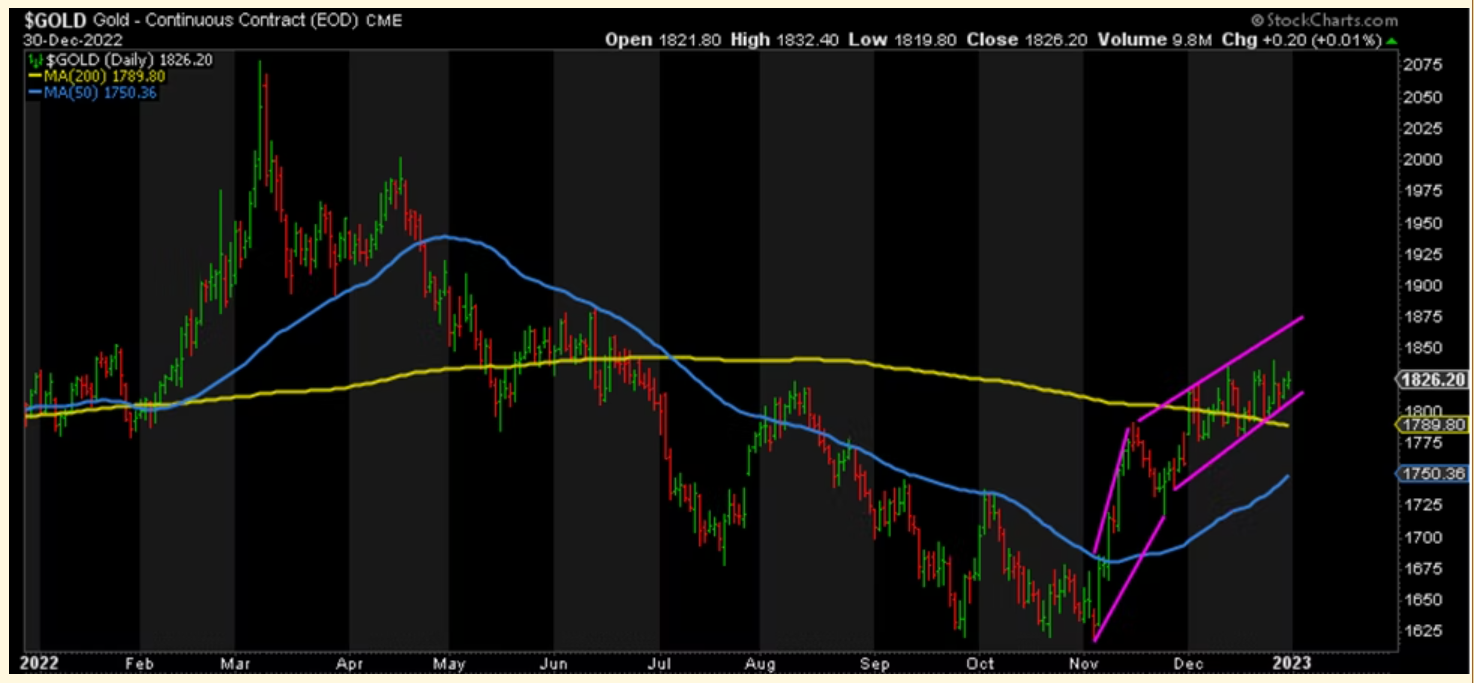
The trend in Gold is clearly up. We’ve got a series of higher lows and higher highs. This does not negate a pullback. In fact, Gold could fall to 1741, a single dollar above the low of 1740, and still be in an uptrend. But the trend is your friend until it isn’t and unless and until we break rising support at 1810, Gold can continue to go higher and higher regardless of extreme and overbought conditions.
With regard to the DXY, it could continue to fall. Ever since the Fed began tapering its rate hikes, the DXY has plummeted. With inflation data slowing and the economy sliding into recession as jobless claims rise, it sure looks like 25 basis points is the most we can expect from the Fed in terms of the next rate hike. This further undermines the case for a stronger dollar, which would boost Gold.
The same goes for real yields. While they have risen while Gold did too, if real yields turn down, that should be supportive of higher Gold prices.
Then there is the COT data showing that open interest is at its lowest level since 2018 when Gold reached 1167 and took off to 2089. The Commercials also have their lowest short position since early 2019.
CONCLUSION
In conclusion, a strong trend can negate other indicators, such as extreme sentiment, divergences, momentum, and factors like the DXY and real yields, for quite some time before it reverses. But reverse it always does. Wave 2 always follows Wave 1. The key question is from what price?
For those of you who are long, if you believe the bottom is in as I do, then you can choose to just ride out any pullbacks along the way, and buy the dips as they come. For those of you who don’t own any physical metals, I recommend you consider buying on the dips, because they will come. I don’t recommend shorting a bull market. You could get run over by sharp moves higher. Only a drop below 1675 would signal that lower lows are possible.
I believe there is a pullback pending, confirmed by a break of support, but I won’t be shorting Gold, Silver, or the miners. I’ll be waiting to buy the dip because what follows plans to be a spectacular rally. It’s called Wave 3!
Thanks for the post and opening the door for a discussion on his thesis. Since he is basically bullish and he does a good job in making his case he may be correct about a quick pullback but here are my arguments why I don’t believe that will happen. Given the environment over the last two months with gold rallying off the bottom and getting over both the 50 day and more recently the 200 day mvg. averages, it was more likely any sharp pullback would have happened already. In fact there have been repeated attempts to take the metals(both gold and silver) down and they have been unable to build on those short term pullbacks. Why now in the New Year when you have a multitude of reasons for sellers to have been exhausted and buyers to be gaining the upper hand, for the sellers to now gain the strength to push prices substantially lower when they couldn’t for the last two months for both gold and silver? I believe his sentiments are wishful thinking because we always want that last pullback to finish our buying plans at better prices. The one caveat that always comes with a manipulated market where the marginal price is set on a rigged futures market, is that in the very short term the bankers can and do whatever they want. So he could very well be right especially if some geopolitical event leads to a quick dollar short squeeze but I think this is what everyone else who sees what is going on in the world relating to Russia, China, the BRICS and pricing of oil, gold etc.is waiting for. Things have been going in slow motion precisely because the powers that be have been slowing down any rush into precious metals. Had they not been pulling out all the stops up to this point, gold would already be back at 2000 by now. You are wise to keep some powder dry in case he is correct but I would advise anyone who isn’t already in or is waiting for that great buying opportunity to materialize, in the same way I have been for the last four months. Keep buying on a regular basis starting immediately. A $100 or $150 dollar drop isn’t going to make a hell of a lot of difference if it comes given that even the author believes it is only a matter of time before we see new highs. What if that happens real soon without any drop first?
Sir Chartmaster, Very wise words … the downside is not much and upside is infinite 🙂
By the way have you made any updates to the 10 explorers/juniors that you posted in 2022?
Cheers
No, nothing on the juniors for quite some time as it was obvious they weren’t going to get going again until gold got back at least to it’s highs. Good timing on your part for asking though. Now that the year end tax loss selling is over, if gold is indeed going to break out, the juniors will join in and probably out perform. It has been a long wait and while I haven’t added to them I also haven’t sold any either.
Thanks for the detailed report Rob
Please use the media link to post charts and use Medium size
I reduced the chart size
Large charts take up a lot of page space and band width…thanks
Fully
Sorry
I did not realize that it causes charts were using up a lot of band space.
Will be more careful next time 🙂