For the Chart Fetish among us
Yes, I know, I could also chart just a GDX-15 or any other GDX-chart. But I have posted the big picture on GDX (monthly) already in progress forming right shoulder of its MEGA H&S pattern. And until GDX does not-BO above 30/31-ish the BEAR-case (for GDX) is my view going forward and is why I choose DUST instead of NUGT. So I dive into much smaller time frames and actually take a 2x ETF DUST (inverse GDX). I believe that there is truth to be found in such double/triple ETFs and gives some sort ‘look around the corner’.
Here DUST-15 chart.
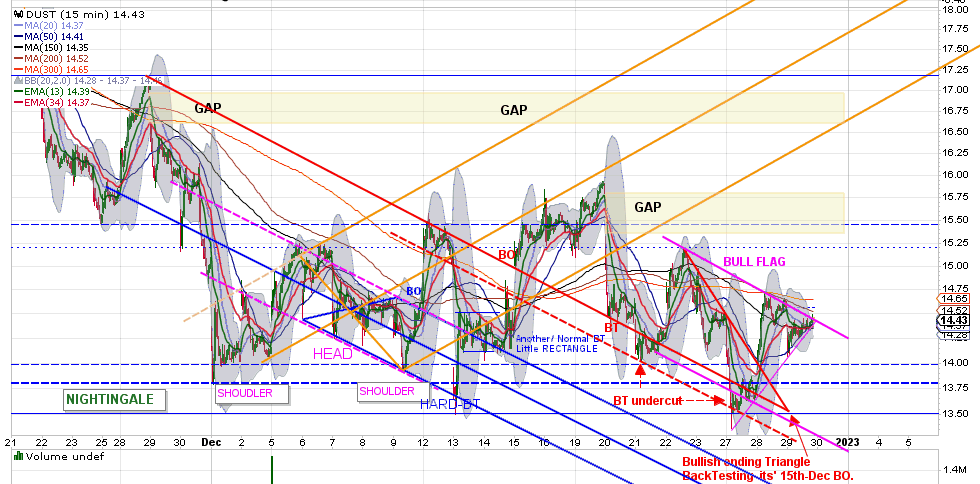
DUST still bottoming as inverse GDX-topping until GDX 30/31-ish BO-UP. In general one could state both DUST/GDX are in a rectangle and nothing has been decided which way it goes (bull/bear fight). The pattern above potentially shows a large H&S with two shoulders each side; just imaging. Hahaha.
Alternative: DUST BO-UP since 15th dec and has been BT-ing it’s BO (see Down sloping RED line). As of last few days … DUST could be forming a PINK (little) BULL FLAG on top of the RED Down sloping line. Any chartist with an experienced eye have seen SET-UPS like these before ‘The REAL Break-Out’. With that I mean formations like: little bull flags on top of a larger Bull flag or little Bear Flags below a larger Bear Flag. And such equals the PINK BULL FLAG. Will DUST BO its’ little TRIANGLE here or does it need another (lower) test.
Last note: the sub-header of this site clearly mentions: FOR PRECIOUS METALS TECHNICAL ANALYSIS ENTHUSIASTS.
You can call me such an ENTHUSIAST. Thank you. Let’s Go Happy Charting 😉
Very detailed chart…yes nice to see you back and Charting Sir Nightingale
I differ in what I would label your Bull Flag
It has formed in a down trend so I would call it a Potential Bear Flag
Since its a 15 minute chart however it is less likely to be predictable
Thanks for your CHARTS