GDX & USD
So this is my Trade Plan. Observe the GDX monthly long term, How obvious and plain in sight is the MEGA H&S-pattern while now GDX is in BT-mode creating a right shoulder. Until this 30/31-ish for GDX gives way (meaning going higher) I stand by my thesis that GDX next direction from here is DOWN.
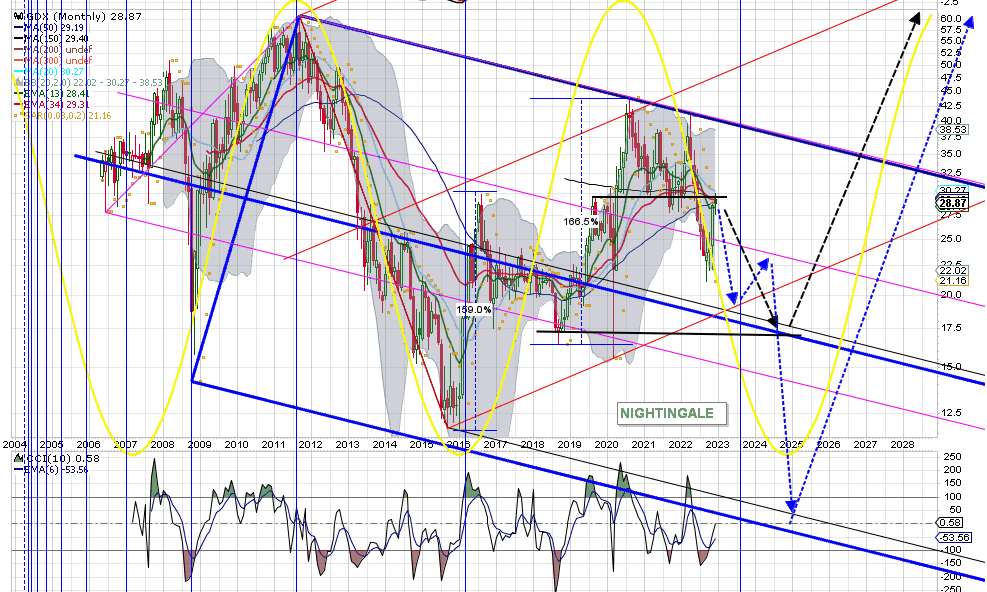
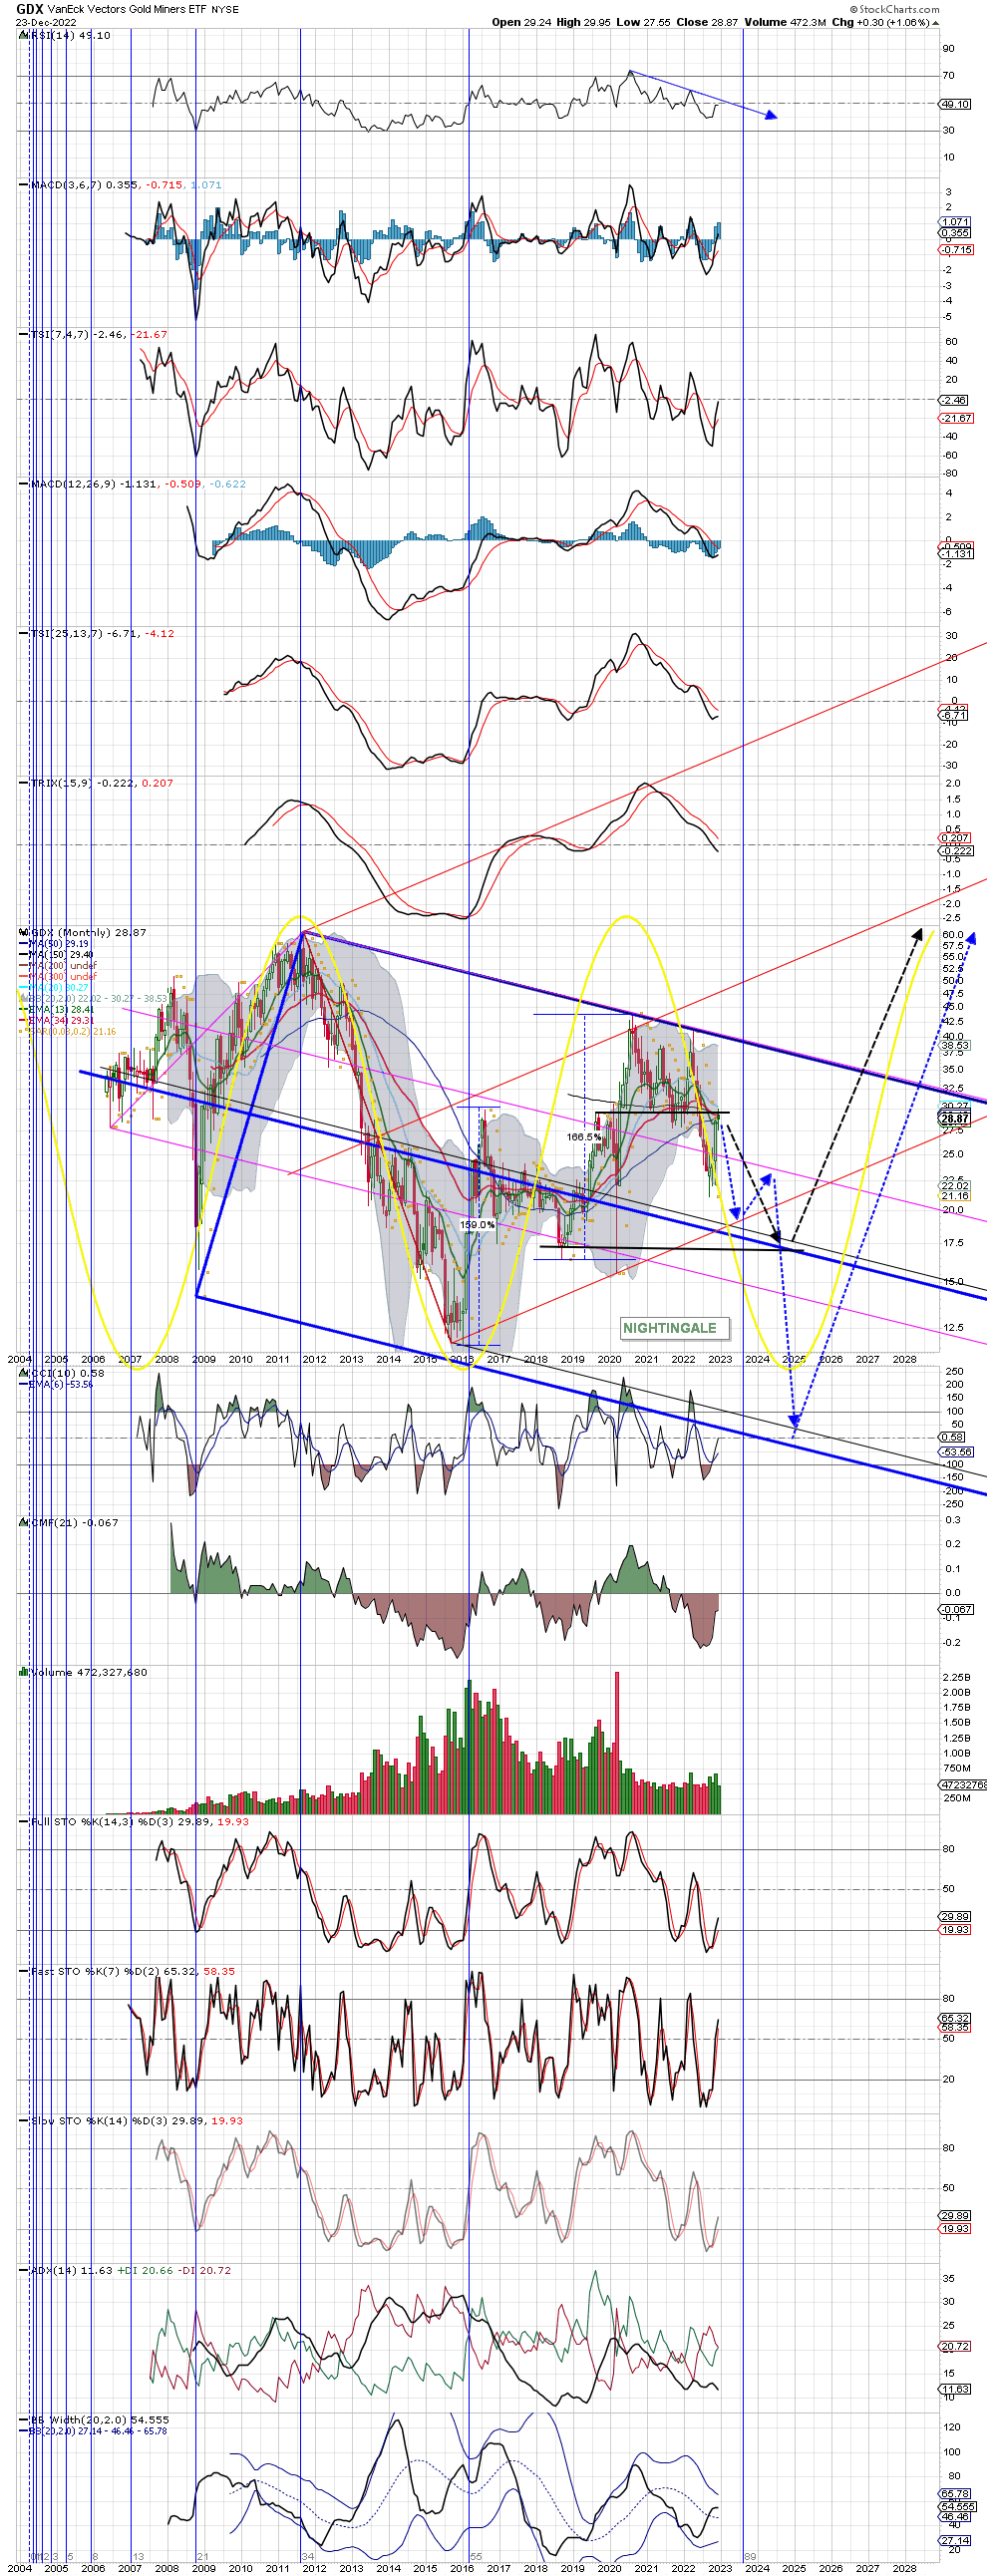
With the month almost ending … GDX progressed barly +1% on the whole month – a sign of a PAUSE or a HARD-BREAK making GDX turn its’ direction from Right here. Choose your Plan!
USD-weekly is finishing its’ BT on the RECTANGLE-BO. Seems obvious to me and therefore USD should go Jumping higher from here giving it +1 week slack or so even though it’s below the WEMA(30) but at the M-MA(50). Therefore if USD is bullish it should recover its’ WEMA(30) rapidly which could give a rapid Break-down of GDX/assets and such could easily happen in the H&S-formation (on GDX).
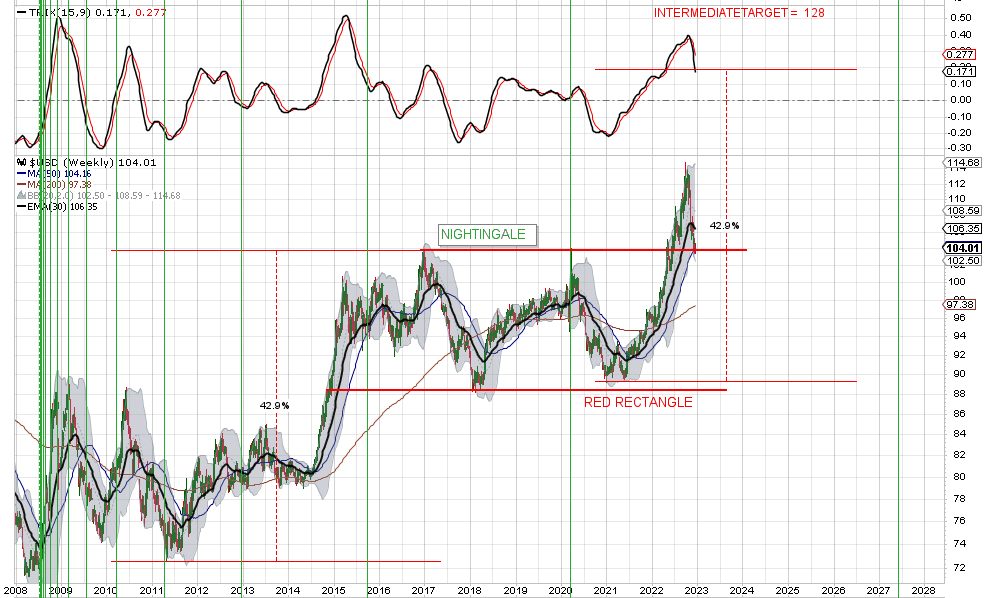
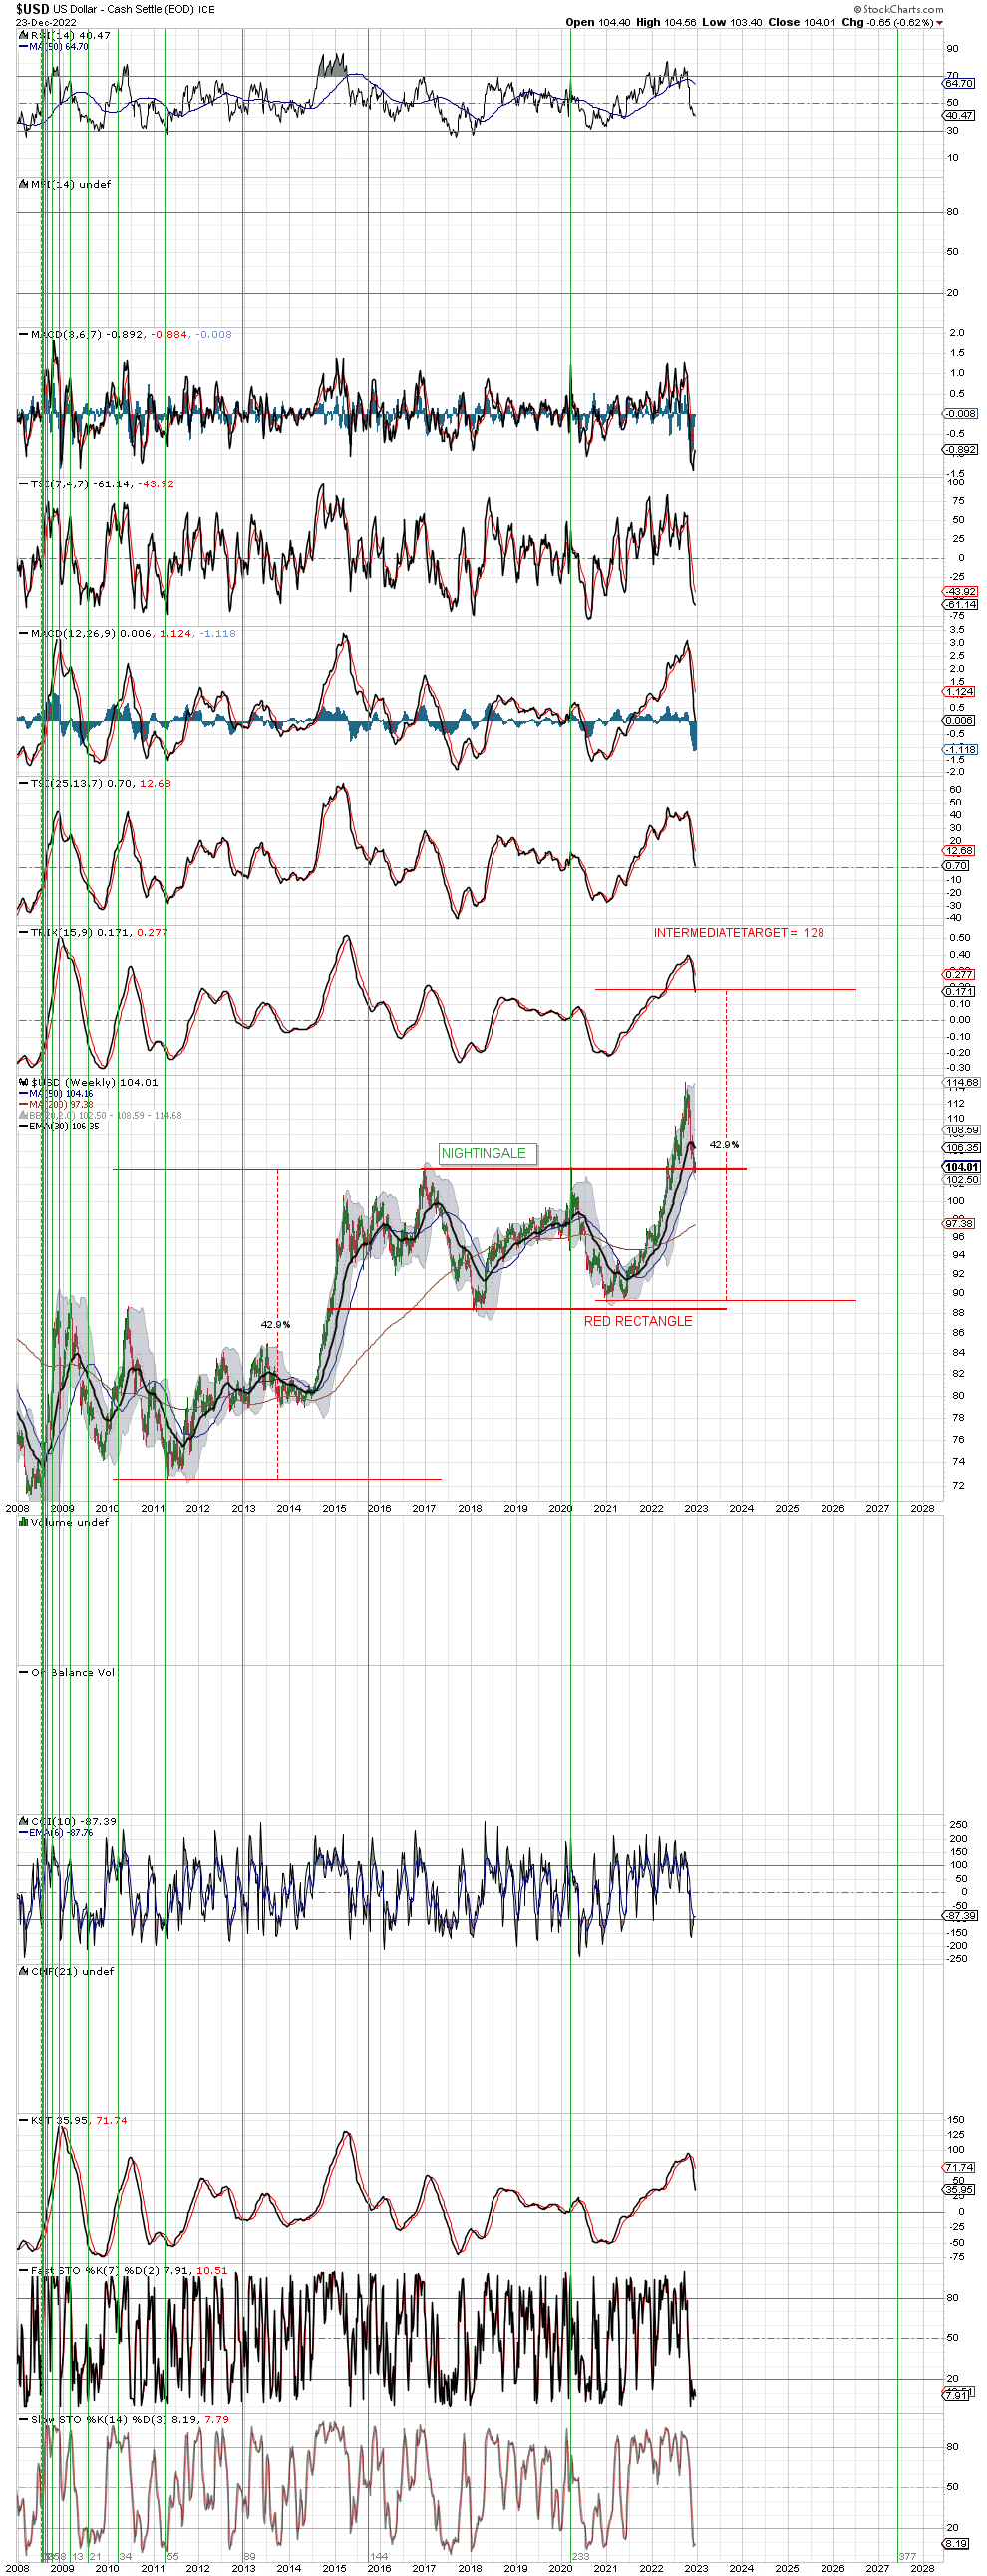
Indicators on the USD-Thumnail shows they have ‘cooled-off’ and gives reason for a USD-turn UP as some indicators shows ‘oversold’ conditions which could get stretched some more but . . .
DYODD. IMO.
You could be right but I think the next strong down move is a long term buy and hold maybe fairly soon. It does appear as if the DX is trying to hammer in a bottom above 1.00 but there will come a time when the metals and the DX go up at the same time.
Excellent point. I have commented in the past that while on a very short term basis (intra day and daily moves) there is close inverse correlation between the dollar and precious metals suitable for futures trading or entering and exiting positions. There is plenty of precedence for different times in a cycle when they can both move in the same direction for months and even years.