GDX
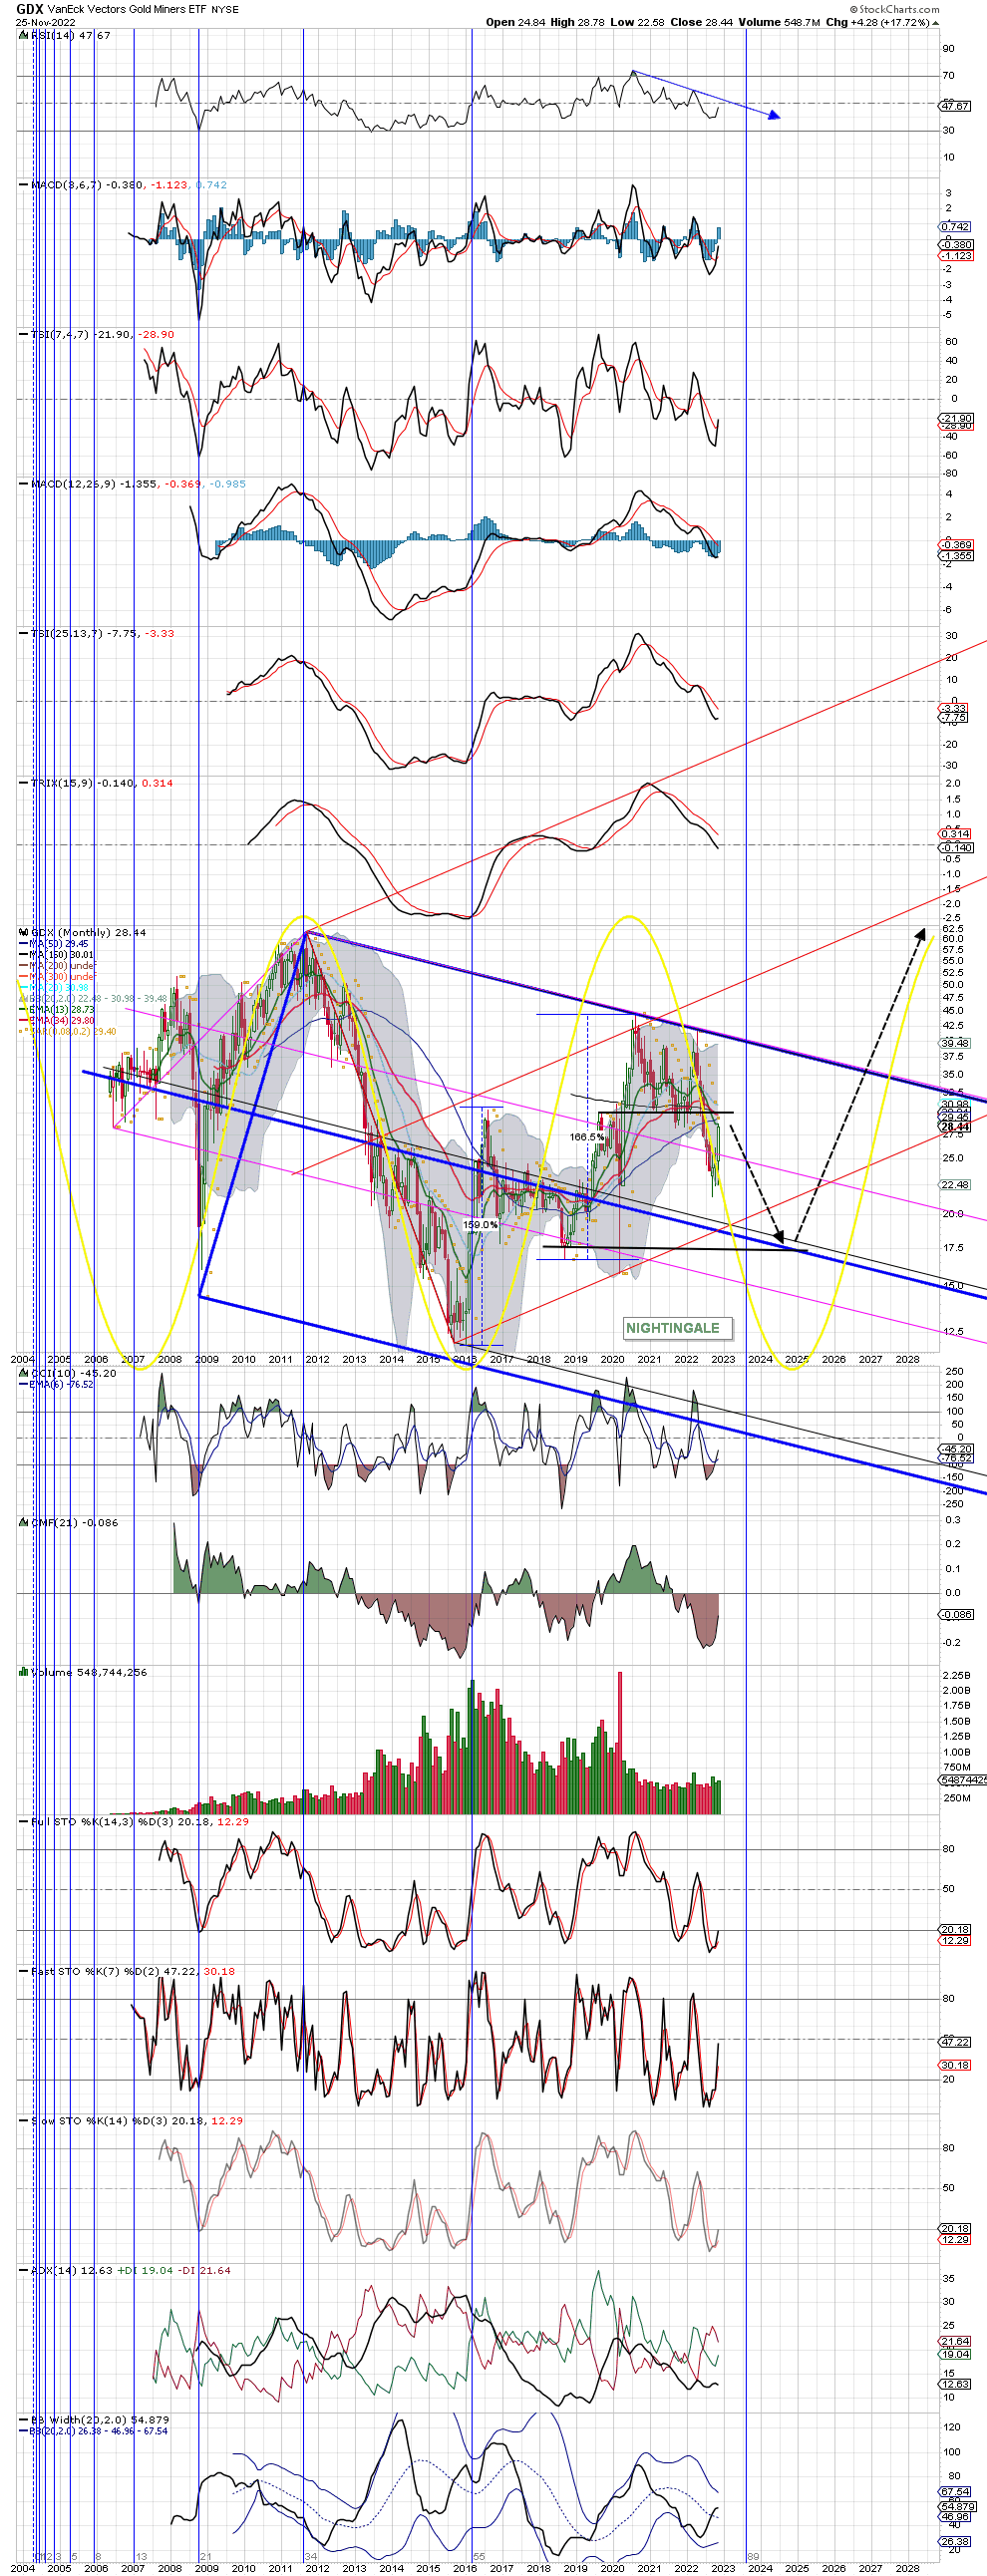
Here my long term GDX (monthly) chart which except the Black little lines I have not adjusted for long time and so far give me confirmation going forward. In general I am NOT BULLISH towards miners for atleast another 2 years according to YELLOW SINE WAVE and many other individual charts. Sorry Buls! I do see for some miners 2024 as an important turn but others more the year after.
Obviously there is a multi-year Head & Shoulder (H&S) pattern in progress where GDX is now in progress of Back-Testing (BT) the HEAD from below – see little Black Horizontal line @ approx. 30 where also several m-MA’s to find heavy resistance. Let’s see if GDX can get above 30 which I doubt but taking indicators into account (see chart), it has (little) chance while GDX is still oversold not withstanding ‘lower lows to be find’. On a bearish view … with recent jump (read BT in progress), indicators did cool-off and potentially BT completed.
One can observe 2x measurements of approx 160% from 2016 to 2020 (4 years – almost 5) which shows a finished HALFWAY PATTERN which at that time signaled me the TOP was in (!) and from there it made a Double Top (DT) this year (2022). So 4 years up equals 4 years down (potentially) – see SINE WAVE. There are 4 FORKS to be find in this chart where I see the BLUE FORK as main. In a glance one could see a BIG BLUE BULL FLAG and a H&S-pattern. Therefore the BULL case is still there . . . but not before a few years. BLACK DASHED ARROWS is my Scenario!
ADDED: on an ever larger view one could see a LARGE INVERSE H&S with 2024/2025 as the Right Inverse Shoulder . . . just to give credence to the BULL CASE for GDX.
PO 2024/2025 for GDX = 17.5 – maybe spike lower @ 14.5.
If I would be LONG-MINERS at this moment . . . I would sell in the coming days/week while GDX finish its’ BT @ 30 approx and GO SHORT. IMO.
Thanks for the chart Nightengale…so Gloom and Doom in the mier space as usual for 3 more dark years…right ?
This GDX-pattern forecast also matches my EURO chart which has an intermediate high in 2025 (after crashing towards 0.86 – 0.80 first.
On an even more bearish view … observe the RED thin FORK which can be seen as a BEAR FLAG. Rule of thumb of FLAGS … it goes back to the beginning which gives option for GDX makes a DB @ 11 approx. We will analyze such in due TIME as in an EXTREME MARKET CRASH it cannot be ruled out the the LOWER LINE of the BIG BLUE BULL FLAG get a ‘test’ eg. tag. And we ALL expect some kind of annihilation in markets so the latter scenario (tagging lower line of BLUE FORK) is a possibility.
Consider this BEAR scenario as THE WEALTH TRANSFER of a LIFE TIME scenario. So prepare and till then just watching markets and eating popcorn.
Roughly in the same boat.
When will bucky top for good? (and What Exactly has to break?)
The risk off trend will dominate until then.
USD-TOPS in 2027
see: https://goldtadise.com/?p=557134
… and What Exactly has to break? …
I have given thought on this. What I see happening is the USD goes parabolic (possibly 380 approx x4 todays value/exch = see link above) … then EM gets crushed to such an extent (which is the plan = bankrupt everybody/Nation ‘own nothing’), then ALL-EM will REJECT the USD … et voila, EM and therefore BRICS+ will stand united, present a new currency and ban USD for good giving it ZERO-VALUE going forward. IMO