THE MOST IMPORTANT CHART ON THE PLANET
Rambus Charts the Dollar like NO ONE on the Planet IMHO
This is just a sampling of tonite’s Dollar Update A Goldtent Exclusive . The Implications are Seismic !
Take it away Wizard ( This work is posted exclusively for Rambus members in FULL here It Includes all the other major currencies as well)
https://rambus1.com/2022/04/24/weekend-report-us-dollar-2/
………………
Snip
“With the massive tectonic plates in commodities, interest rates and inflation shifting just below the surface I would like to update some charts for the US dollar and other currencies of the world to see how they are being affected. I did an in depth look at the US dollar and currencies at the end of January of this year which I would like to compare to the present. Most of those charts were showing bullish characteristics for the US dollar which has continued to the present”
January 30th 2022:
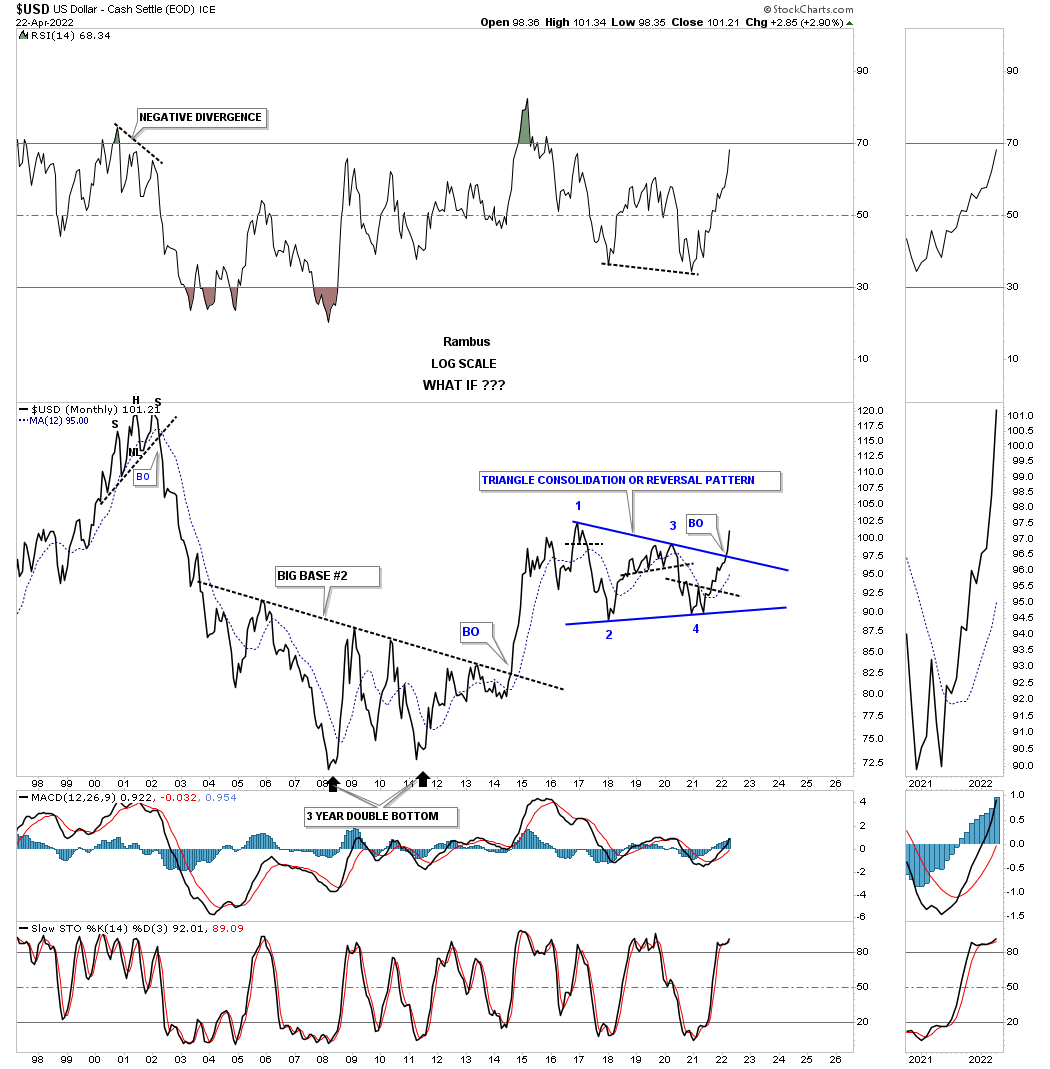
Below is the infamous long term monthly chart which shows the fractal bases labeled, big base #1 and big base #2. It was just an ordinary night and I was looking at some long term charts and noticed how big base #2 lows were forming in a similar fashion to big base #1 lows. One thing led to the next and I made a post of what I had discovered. At the time of that post the price action was still trading below the black dashed S&R line so there was no confirmation yet. This is one of those times when you discover a big chart pattern and then have to wait to see if you were correct.
You can see how the potential rectangle fits into the very big picture. The impulse move out of big base #1 formed the blue bullish rising wedge halfway pattern in its uptrend channel and ended with a H&S top which marked the beginning of the PM’s bull market in 2000.
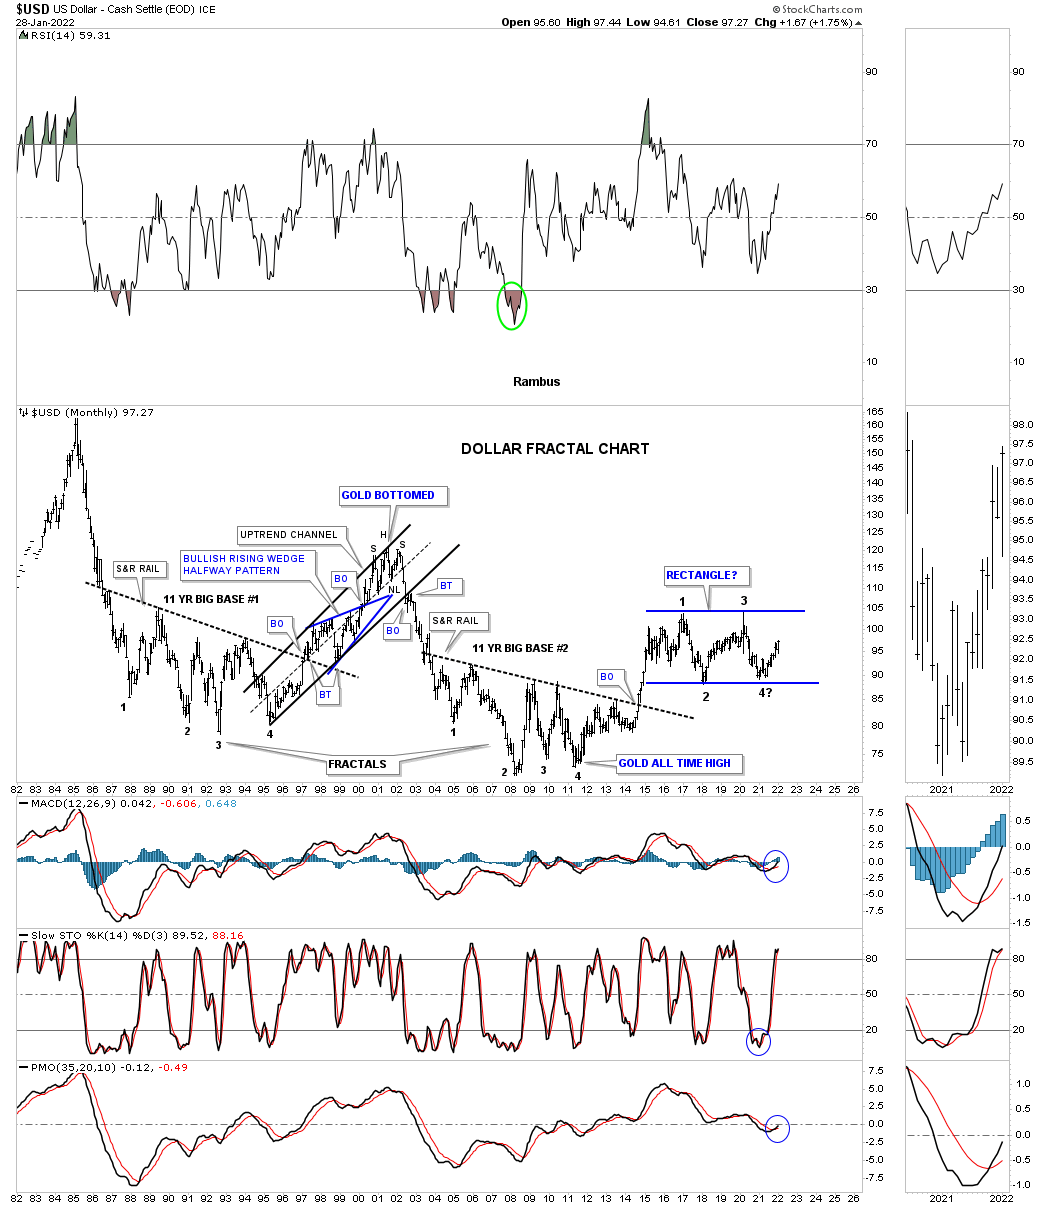
Today April 24th 2022:
The blue rectangle is still under construction.
January 30th 2022:
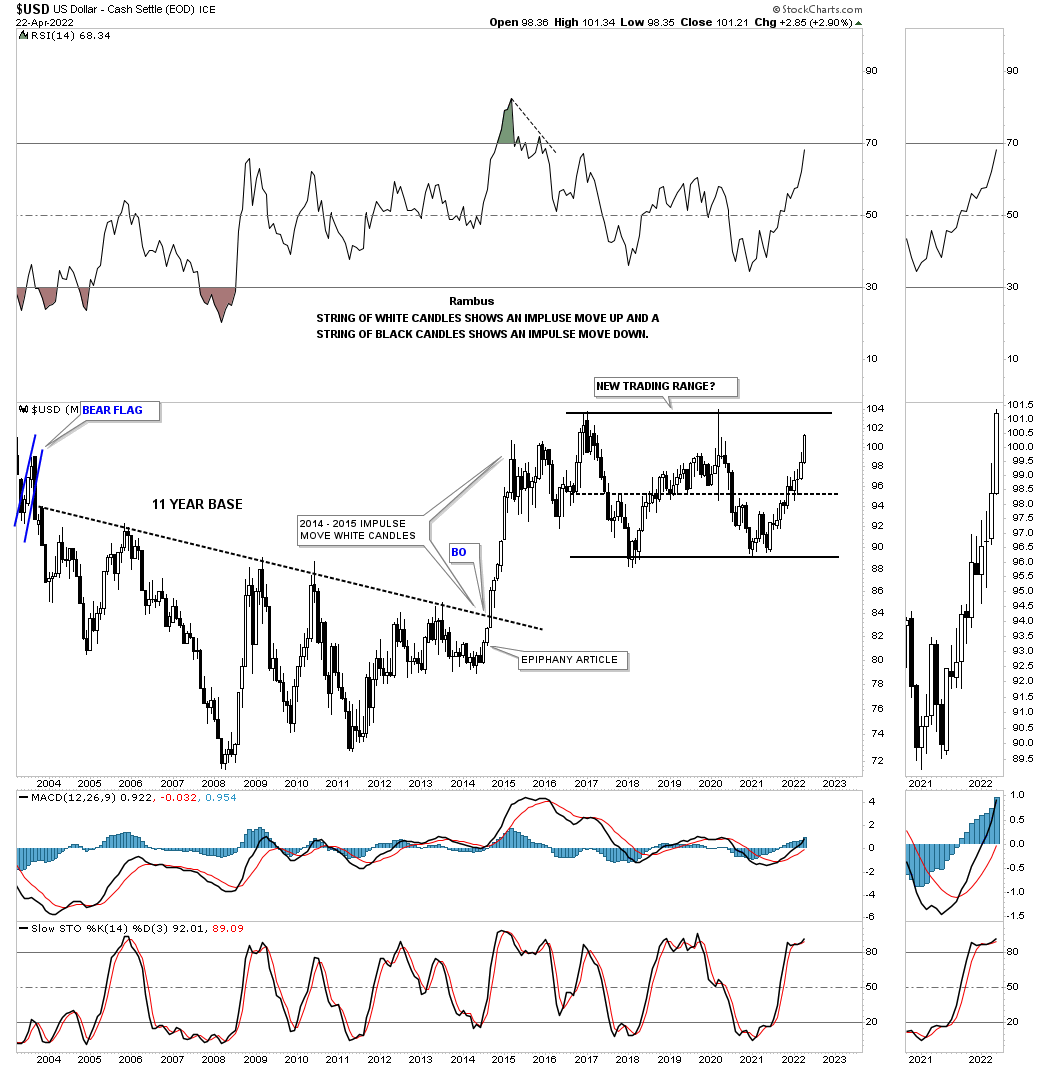
Below is the monthly candlestick chart for the US dollar which also shows a close up view of big base #2 and where I had my epiphany moment. Note the string of white candlesticks all in a row that produced that massive impulse move. Back then that impulse move crushed commodities and the PM complex.

Today April 24th 2022:
Note the number of white candlesticks off the previous low.
January 30th 2022:
There is even a bigger chart pattern I have been showing for many years which is the 30 year bullish falling wedge. After the breakout from big base #2 the top rail of that 30 year falling wedge held support as it was backtested from above. You can also see the large H&S top where the head formed at the 2000 high which reached it price objective dead on the money at reversal point #4 in the 30 year falling wedge which was the low for big base #2.
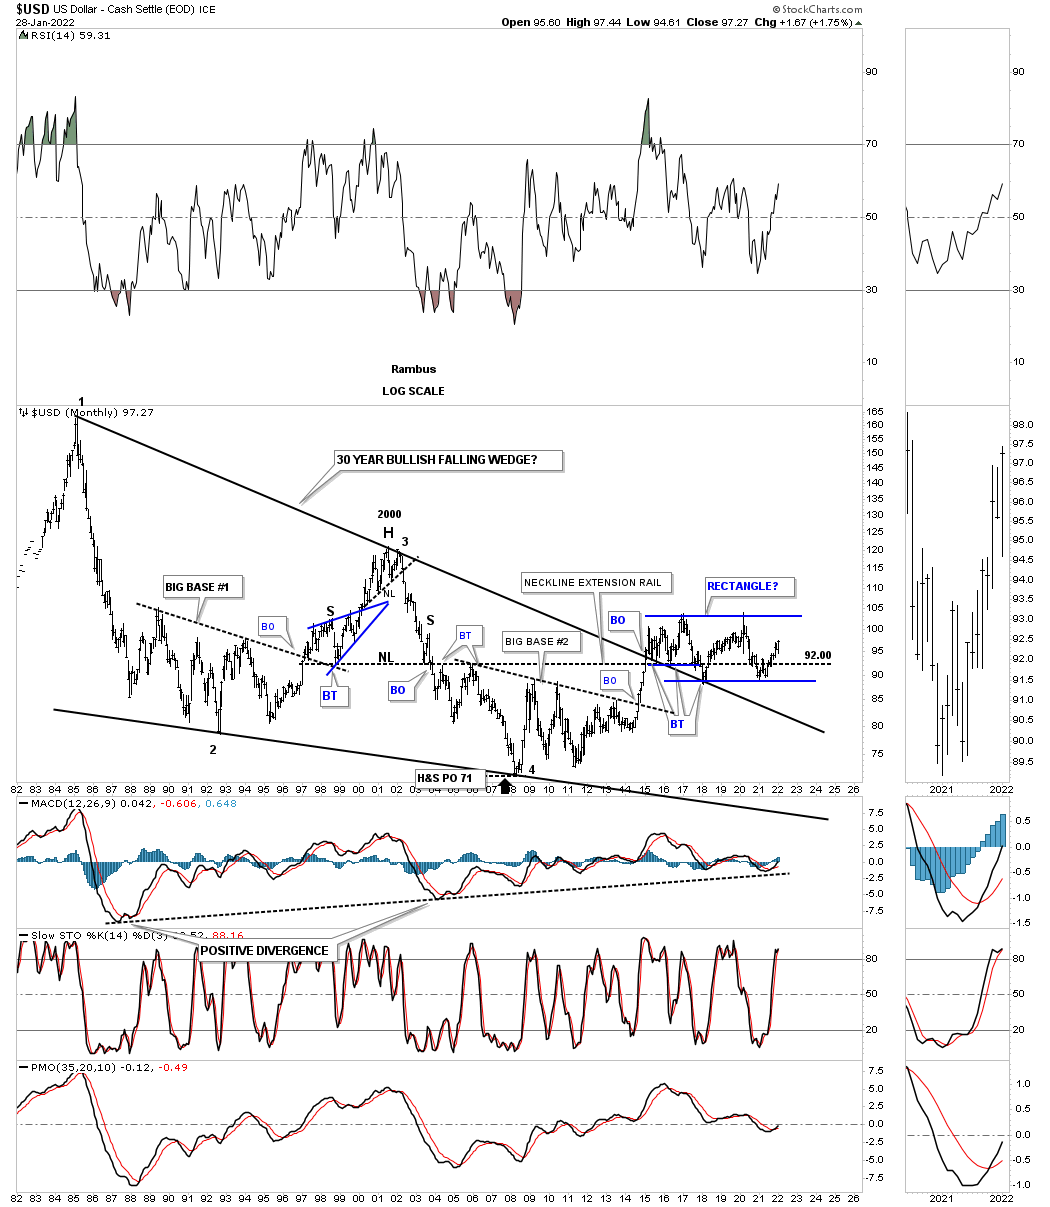
Today April 24th 2022:
Getting closer to the top rail.

January 30th 2022:
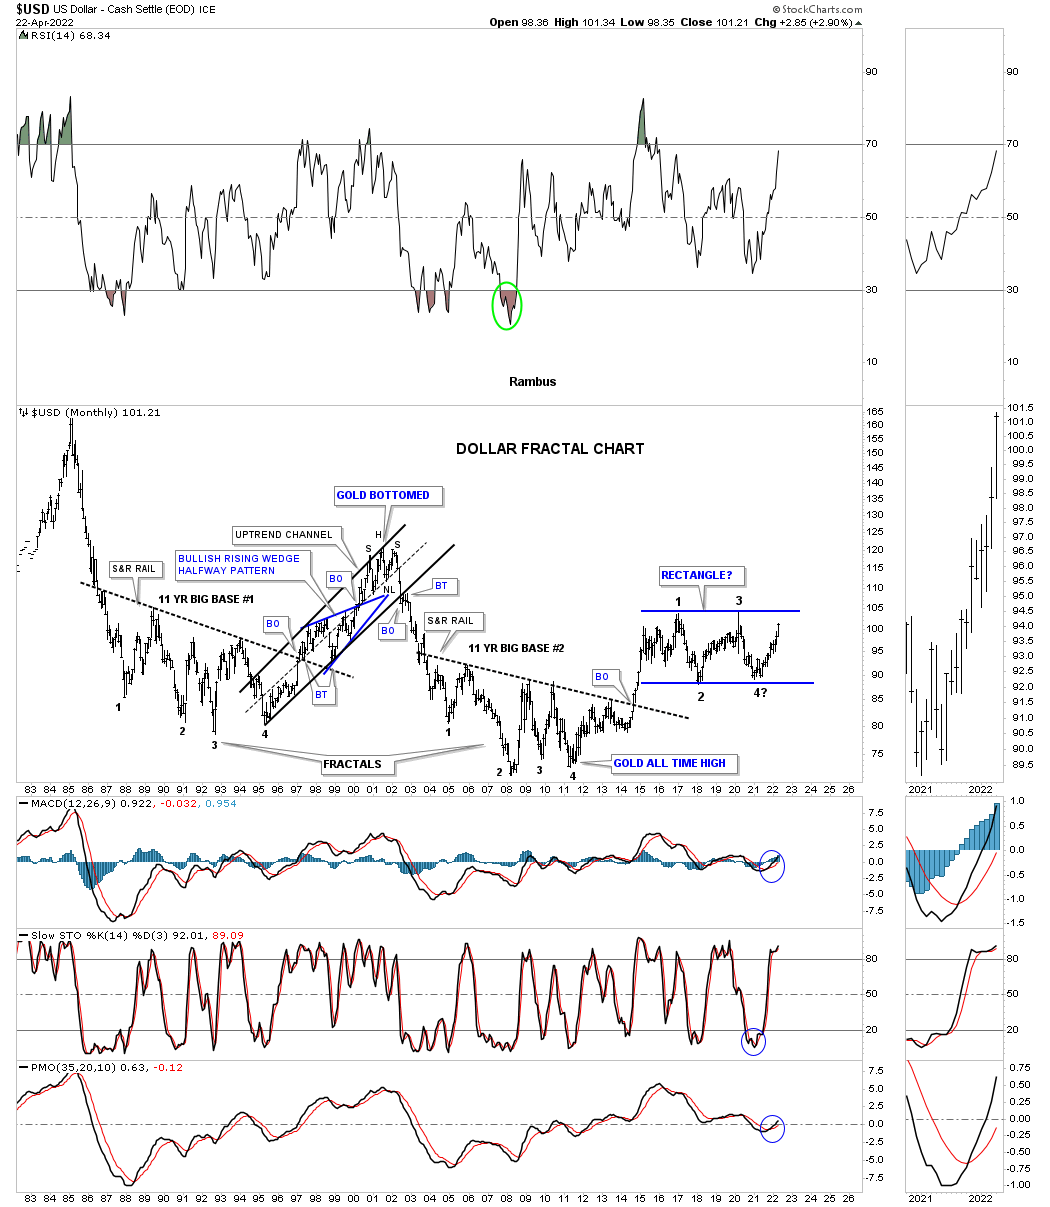
I have mentioned many times that a line chart often times will show you a breakout before a bar chart does. As you can see on this monthly line chart, which only shows the monthly closing prices, the current price action is now testing the top rail of the blue triangle which has now basically completed the all important 4th reversal point from this perspective.

Today April 24th 2022:
The blue triangle had the breakout.
……….
Fully’s Comment : Is this the End of the Inflation Trade for now ? Are we switching to Deflation ?
How can we have Inflation AND a rising US Dollar Index ?
Will the Dollar Rise against the Euro and Yen and Pound and Canadian and Aussie Dollars but Fall against Gold ?
That would be Unusual .
One must assume …DEFLATION ?
To Follow the Most Important Chart On the Planet and a Ton of other important Charts
https://rambus1.com/membership-subscription-service-via-paypal/
Please forgive my simplistic take, and probably without nuance, but weren’t we entering a gold bull a couple of weeks back with rambus, then fully joined the pedro side, and now rambus has taken deflationary stance as well?
Just a bit confused…
Gold has been rising WITH the Dollar Index
Now with the Dollar breaking out can Gold and Commodities still be in a Bull market ?
Confusing ….yes
“Gold has been rising WITH the Dollar Index
Now with the Dollar breaking out can Gold and Commodities still be in a Bull market ?” The answer is yes. If gold and the dollar are rising together, what is gold breaking out against? The answer, of course, is against the other fiat currencies in the index. Doesn’t change the fact that commodities are in demand, supply is constrained and the prices are and will continue to rise. Some faster and in greater percentages than others. It doesn’t change that inflation NOT deflation will continue even if at a different level over time. Forget dollar index. It only reflects the dollar against other useless currencies. Chart it against the Russian Ruble and it is crashing.
Meant to write what is the dollar breaking out against, the other fiat currencies in the index.