Obey the DMI crossover!
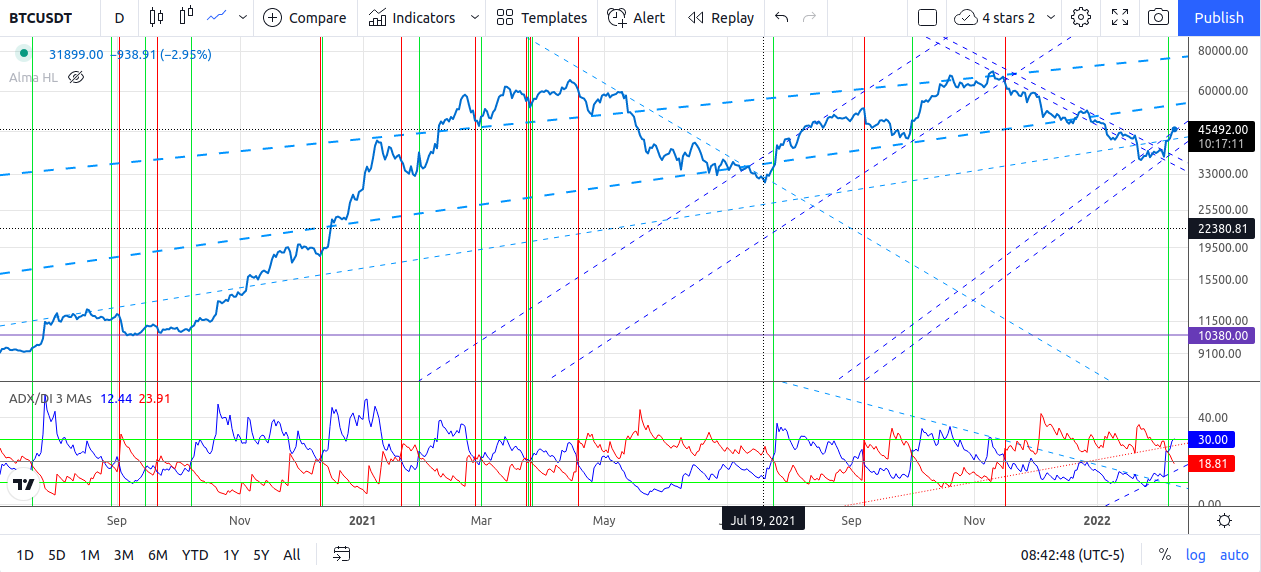
I marked them all. Even the ones I wished didn’t happen. But the losing trades are small and the winning trades are big. Small losses are the cost of big wins. Green is up and red is down. Green is buy, red is sell. Standard 14-bar period.
Add in a few trend lines and it gets even better. Even better than the chart lines is when a three or four-point trend line forms on the dmi+ or dmi- line (+ is blue; – is red) like it did during the recent down-trend.
Funny how a good indicator always tell you to do what you don’t want to do.
I think most traders are really gamblers at heart and gamblers are emotional and your emotions are almost always wrong in trading. We’d rather feel confident than be right. Isn’t that a great definition for stupidity?
I wonder how it works on a chart that isn’t so “rhythmic”; up and downsy?
I like this kind of approach, right or wrong.
Chart based, mathematical, reasoning.
Others could benefit from this kind of tactical approach.
“I marked them all. Even the ones I wished didn’t happen.”
Not exactly sure what you mean here. Are you ‘regretting’ even certain green signals?
I say this, because my charting tells me you will regret this one, unless you keep to a short leash. Not everyone does. Certain posters on this board seem to be good at identifying short term reversals, pounding the table and claiming they have intermediate and long term significance … when it then turns out they don’t. (And they don’t even seem to know why!)
I’m in no way undercutting the ADX ‘rule’ here. Not in the least.
But I am saying its likely a counter trend bounce (off my work), and if you can’t read “The Primary Trend” as Richard Russell used to say, you get whipsawed to death. Lately for cryptos its been down and I don’t have evidence its reversed yet. YMMV. Best of luck!
The one’s I wished didn’t happen are the choppy ones. Apr 2021 there are four consecutive days which the dmi crossed on each day but following these would have been small losses compared with the final cross up. The cross down came late in the downward trend and the upward reversal was the next day only to be crossed down the day after that and then finally crossed up for the next three weeks.
I am definitely one of those short term people I’m afraid to say. But for the last two years, this crossover indicator would have been quite profitable. Also, this recent reversal wasn’t just a crossover but also a break of a trend line on the DMI too. But I’ve been wrong more often than right here. My interest is in a purely momentum system because it’s the only thing I feel confident with.
I find the ADX confusing so I just use the DMI lines. Sometimes it’s a perfect mark of the reversal but for enough of the rest of the time it’s dangerously ambiguous and it’s reversal can just mean that the current trend is increasing and not reversing.
Thanks for the feedback, Pedro. That’s what makes this place such a good learning environment.
One quick suggestion … try that DMI crossover on 60m, daily, weekly AND monthly. See if the picture gets clearer. (I don’t know either way.) My system works basically off “vetos” given by the higher timeframes down, more or less.
Good stuff, TimH. Thx