Something Happened on April 15
No Idea What BUT this graph Ain’t Normal
USA
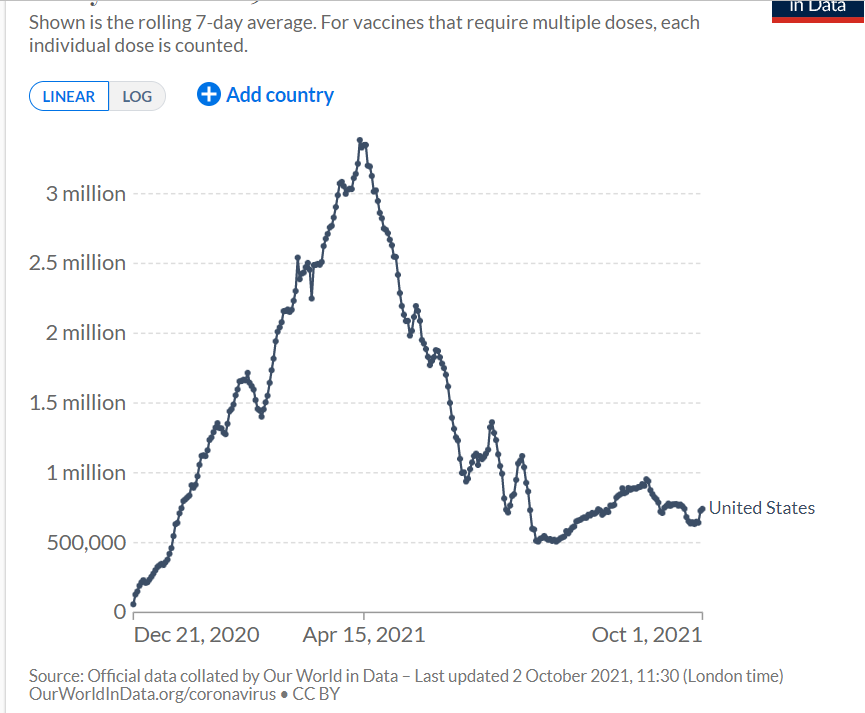
https://ourworldindata.org/search?q=DAILY+COVID+VACCINES+ADMINISTERED+usa
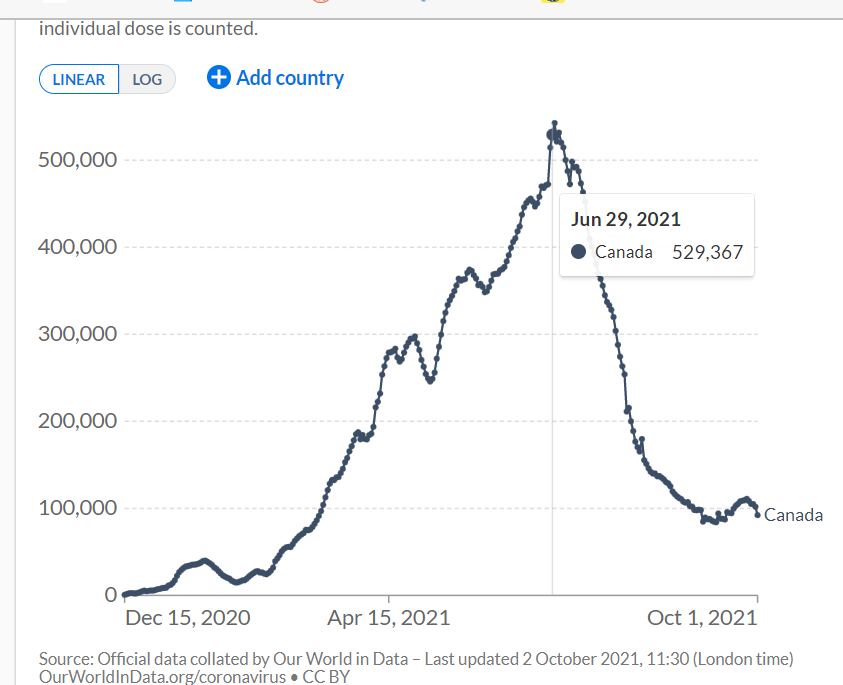
IN CANADA SAME THING AFTER JUNE 29
Russia had peak vaxx on Aug 15 Strange how all these charts peak then fall off a cliff instantly..WTF ?
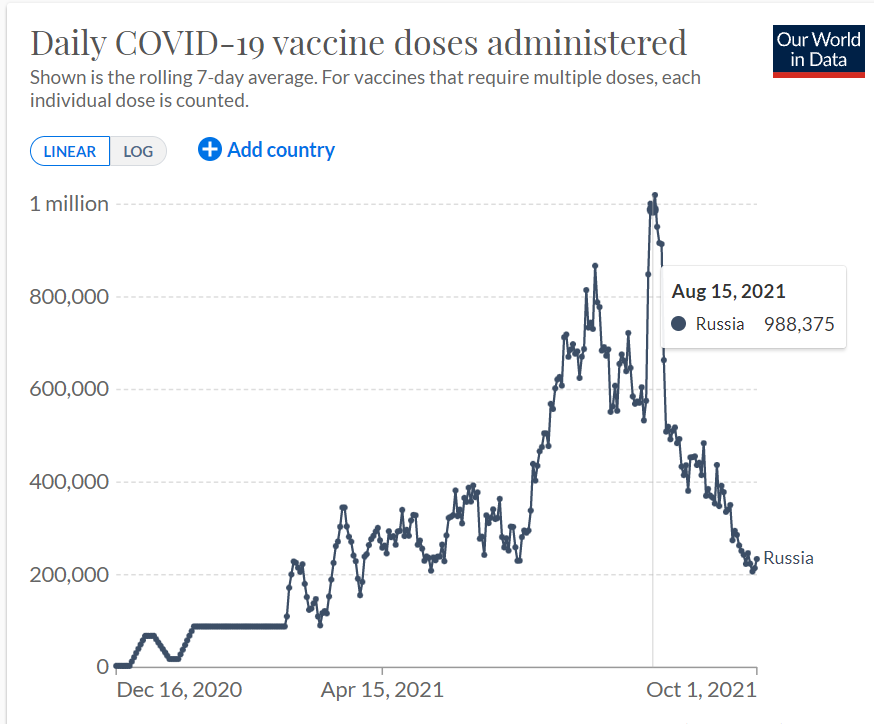
What a Sick World where every single Vaxxine given in the Whole World is tracked and posted in real time
Obsession or what ?