GDXJ weekly
This is WHY I see things the way I do, and how.
I will offer (only) these limited interpretative pointers. The chart basics should be self explanatory.
This chart has multiple layers. You are only seeing one of them. The layers work together, not separately.
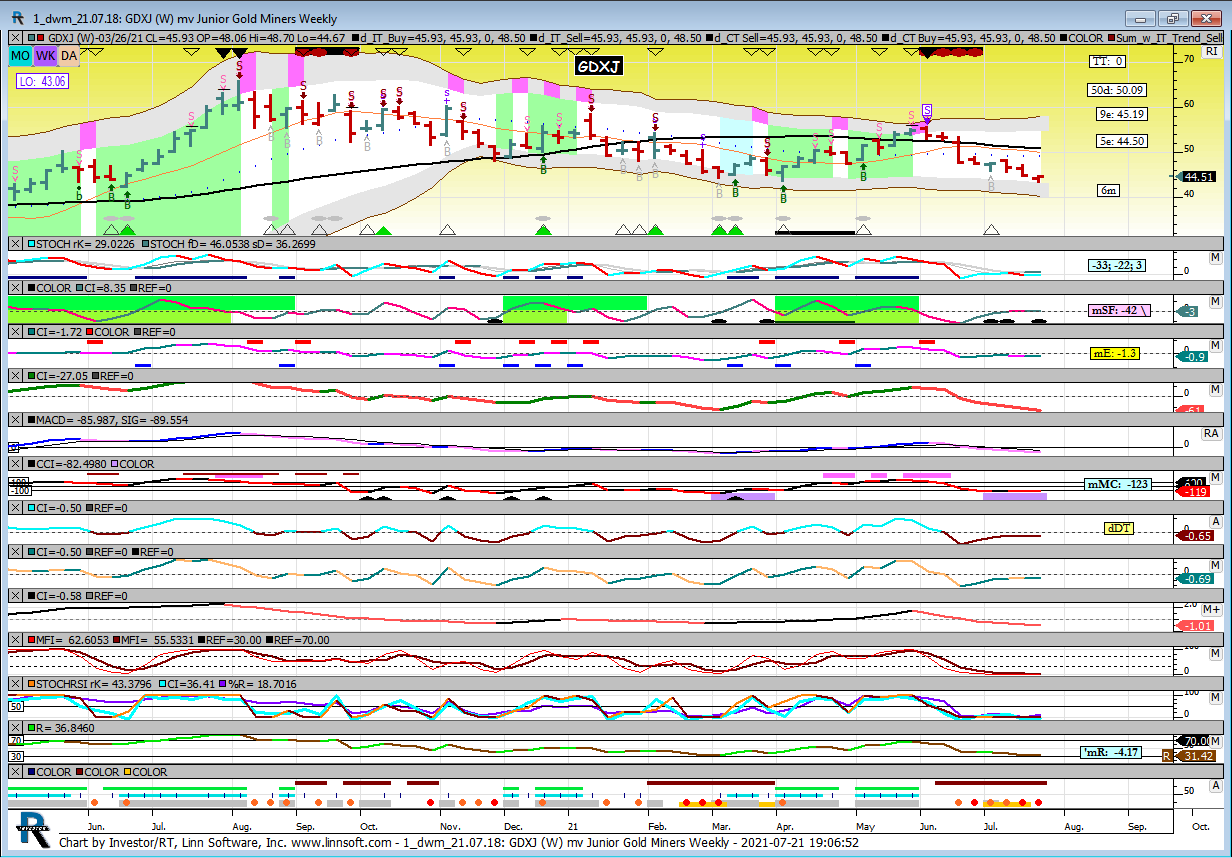
Green shading means bull run. The rest of the time, best of luck.
Black and red markers up top signal the end of a bull run, usually for many months. Forget buying dips after those appear.
Trend buys are dark “B”s. The ghosted versions are counter trend.
That’s it for hindsight on GDXJ.
Inset boxes on Panes 2 and 3 are forward looking. The -33 and -42 tell me when I might expect the next bull run, on a -50 to +50 scale, where zero marks the turn. We aren’t close, and ten points is a typical delta per month. So we’re three to four months away, as of now. These values come from one of the other layers.
Good luck.
Excellent – thanks!