Rambus on the Precious Metals Complex
It’s a Complex ..because…well it’s Complex
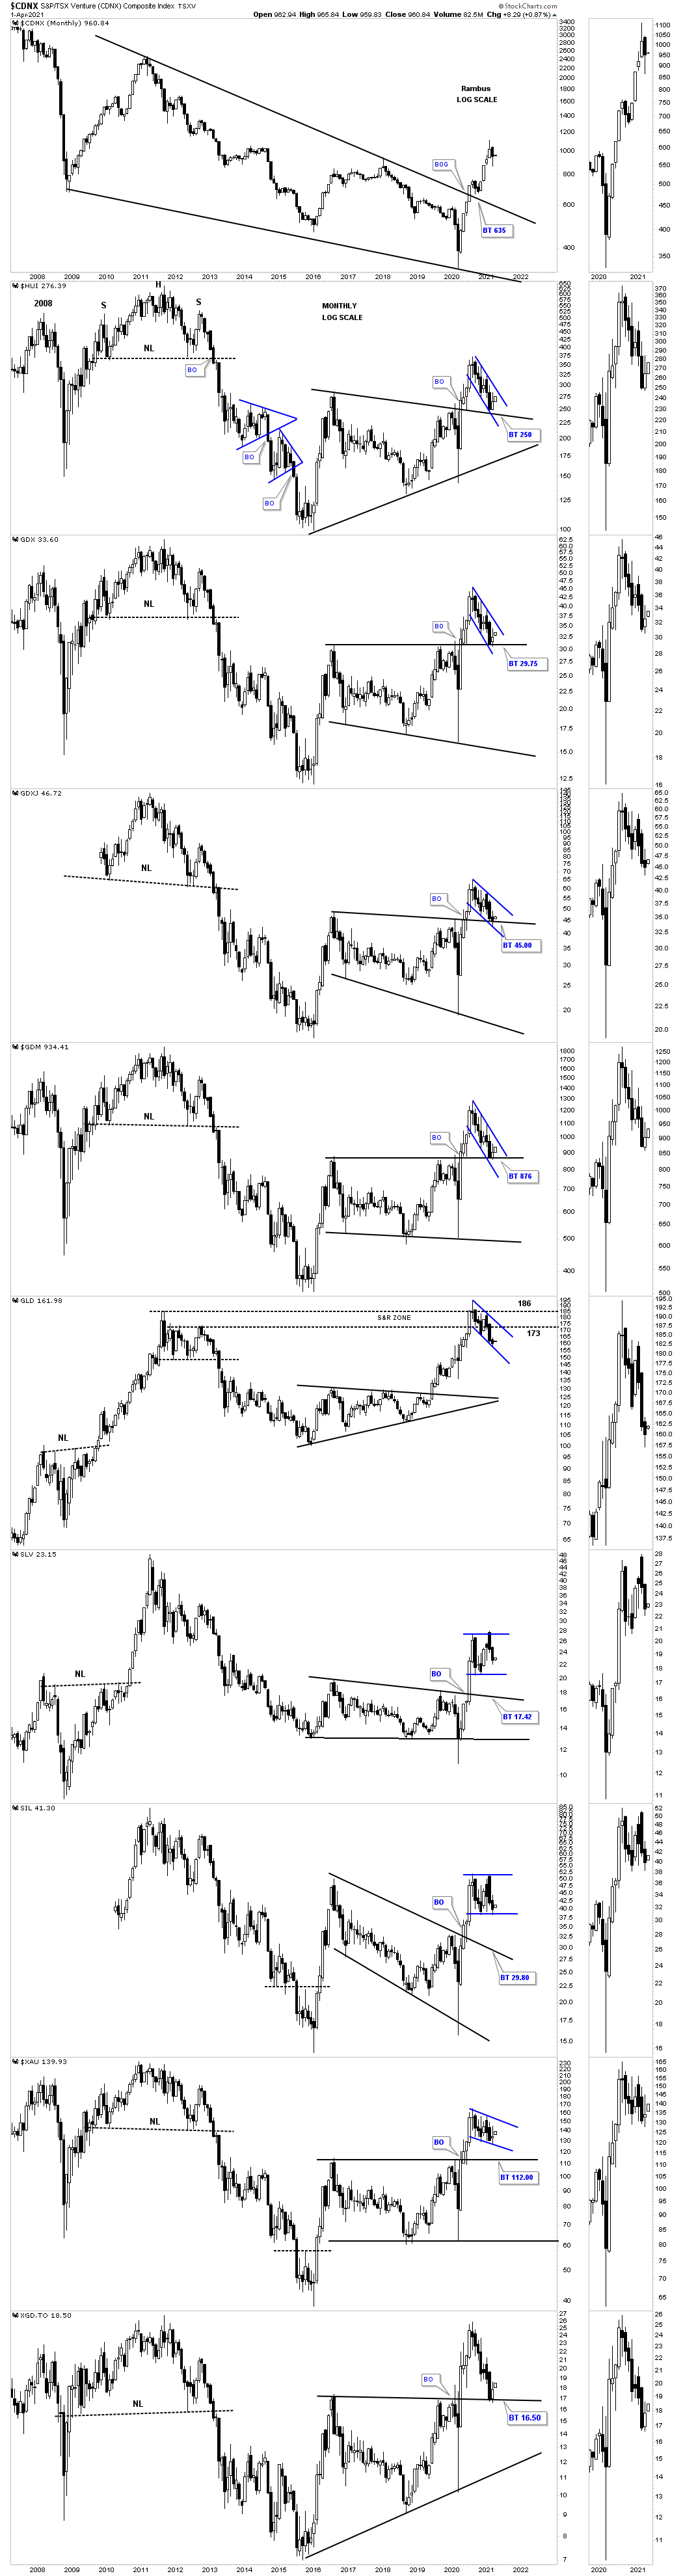
This last chart for tonight is a 14 year monthly candlestick chart for the PM complex. Eventually we are going to see confirmation one way or another on those 2016 trading ranges vs the potential H&S tops on the shorter term time frame. I may not catch the exact bottom or the exact top but I will catch much of the impulse move. Except for GLD the backtesting process to the top rail of those 2016 trading ranges are still holding support and have to be viewed as bullish as of today. Only time will give us the final answer.
click 2X to expand