Using the Daily Sentiment Index
Good day gentlemen,
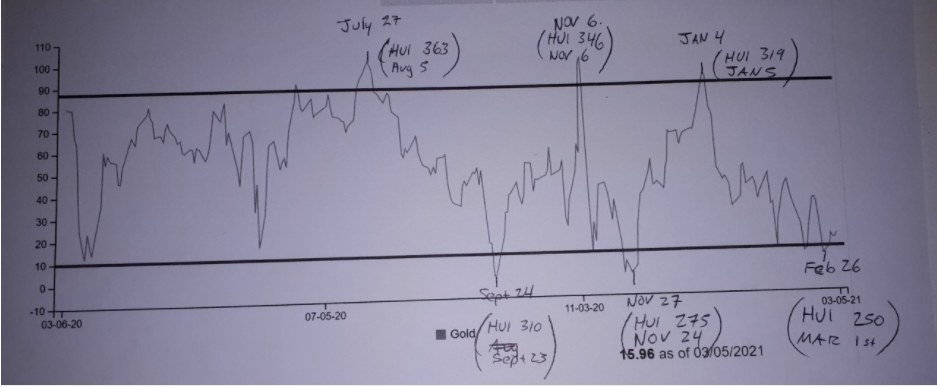
I have been studying the Daily Sentiment Index (DSI) for some time. It measures the publics sentiment towards specific investments. The chart in the picture below, measures DSI towards Gold. I plan to start to use it as a tool to time my entries and exits.
The DSI is to be viewed as a contrarian indicator. When it is above 90%, it means everyone is extremely bullish and therefore very little new money is entering the sector … I.e. the top is in. When the DSI is below 10% , everyone that was going to get out, is out and thus it indicates the bottom is in.
As you can see, the bottom is in according to the chart. I have handwritten what the corresponding tops and bottoms were on the HUI. IMHO, the correlation is consistent and worth considering. I am sharing the link that I use to get the DSI chart. When on the link, along the left hand side you need to select Gold to pull its chart (Silver is found under commodities header).
https://www.traderspro.com/#/marketTrend/sentiment
I would be a buyer at this stage, not a seller.
Hope the picture below is legible.
Cheers
Rob
Sir Walnut, your posts from late last week and today have been very informative and I believe you are correct. The charts of a number of gold stocks(particularly ones that usually lead the market both up and down) are acting positively the last few days. The bottom for the gold stocks does look to be in. It will probably take another two weeks or so before they are ready to takeoff but buying on dips is the strategy from here.
Thank You for this Sir Rob
Keep us posted please
Looks like a great tool. Thanks.
Looks like a bit more of a bottom left to reach to really throw people off. Discovered a gold stock that’s wildly undervalued for a producer, K92(KNTNF) Another is Ramelius Resources (RMLRF). Both hit hard with lots of upside.
Gold stocks now rise in the morning and dump after that as people underwater bail out with each rise. This could go on for awhile.
Thanks for the useful info, Rob.