Trading Gold is All About Extremes
And do we have extremes right now? Yes.
This has been a super odd seasonal segment for gold since the January selloff. Right on schedule with the November first notice date that rolled the December Silver (SI) and Gold (GC) contracts we had a major bottom. In the last 20 years that would normally carry into a February 25/26 topping zone before a decline in March. That is not what happened.
? 2000-2012 bull year seasonality for $SILVER and $GOLD
Silver shows the possibility of continued strength, while gold shows a general decline to April
We *MAY* have an opposite move here for gold going into next month, since the entire sequence of JAN-FEB was "inverted"$GDX pic.twitter.com/SSMEQF7B8o
— Cameron Osborne (@dailyEdgeGroup) February 26, 2021
XAUUSD – Day
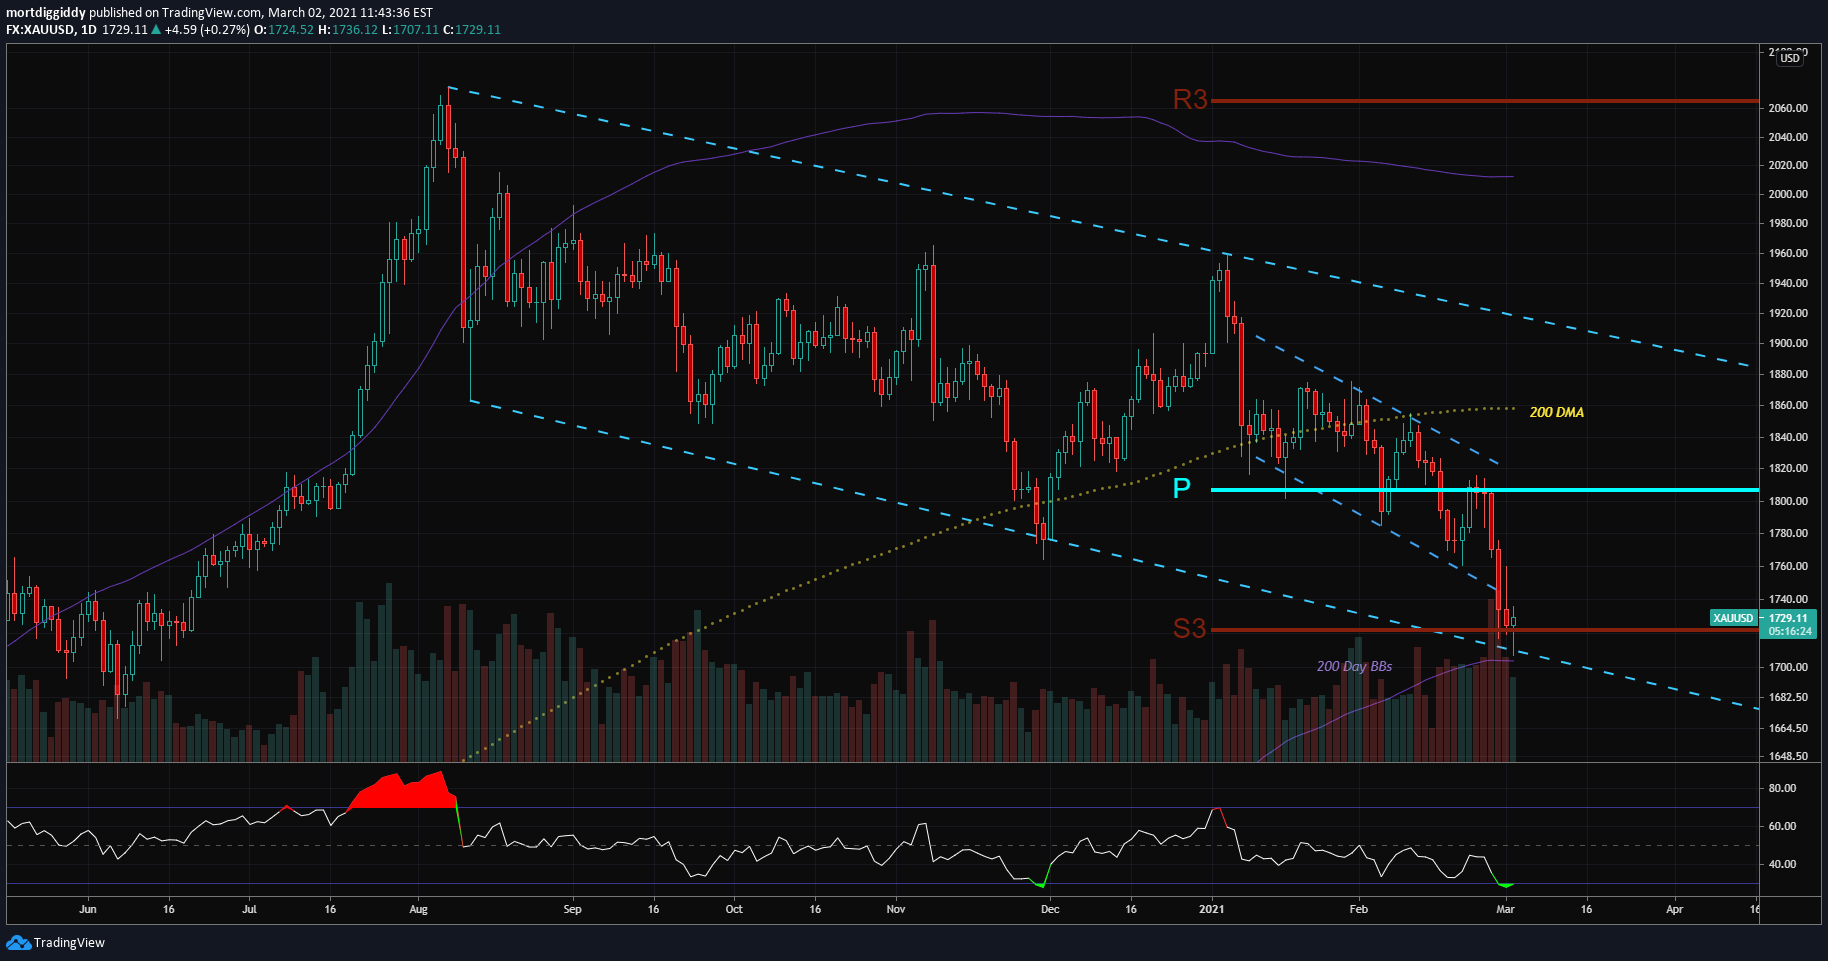
- Year Camarilla S3 strike – This doesn’t happen often, it is a bull trend and we are retesting this. In the Daily Edge Trading Group Camarilla Pivots are our bread and butter and we use them on all assets. I advised folks to get into September call options and physical at this location.
- Daily RSI Oversold – Bottom indicator, doesn’t happen often. The last one was at the November bottom when the December SI and GC silver and gold futures contracts expired. It is important to understand contract first notice dates as they invite capitulations in the futures product, as we saw in 10Y ZN and 30Y ZB futures last week at the bond puke. Before these dates you had to go back to August 2018 to find daily RSI oversold instances.
- Parallel Channel strike
- 200 Day BBs bottom area
- Volume – 2 huge capitulation days of volume into that Year CAM S3. This is important and could be final weak/medium hands dumping longs.
S-Wave Capitulation
I coined this phrase a few years ago and this is precisely what gold has done since the January top (completely opposite early year seasonality I might add). An S Wave starts out with a big impulsive movement down, followed by sideways or melting in the same direction, and then ends with another large move down. The last move down is somewhere in the vicinity of the initial magnitude impulsive move.

XAUEUR – Day
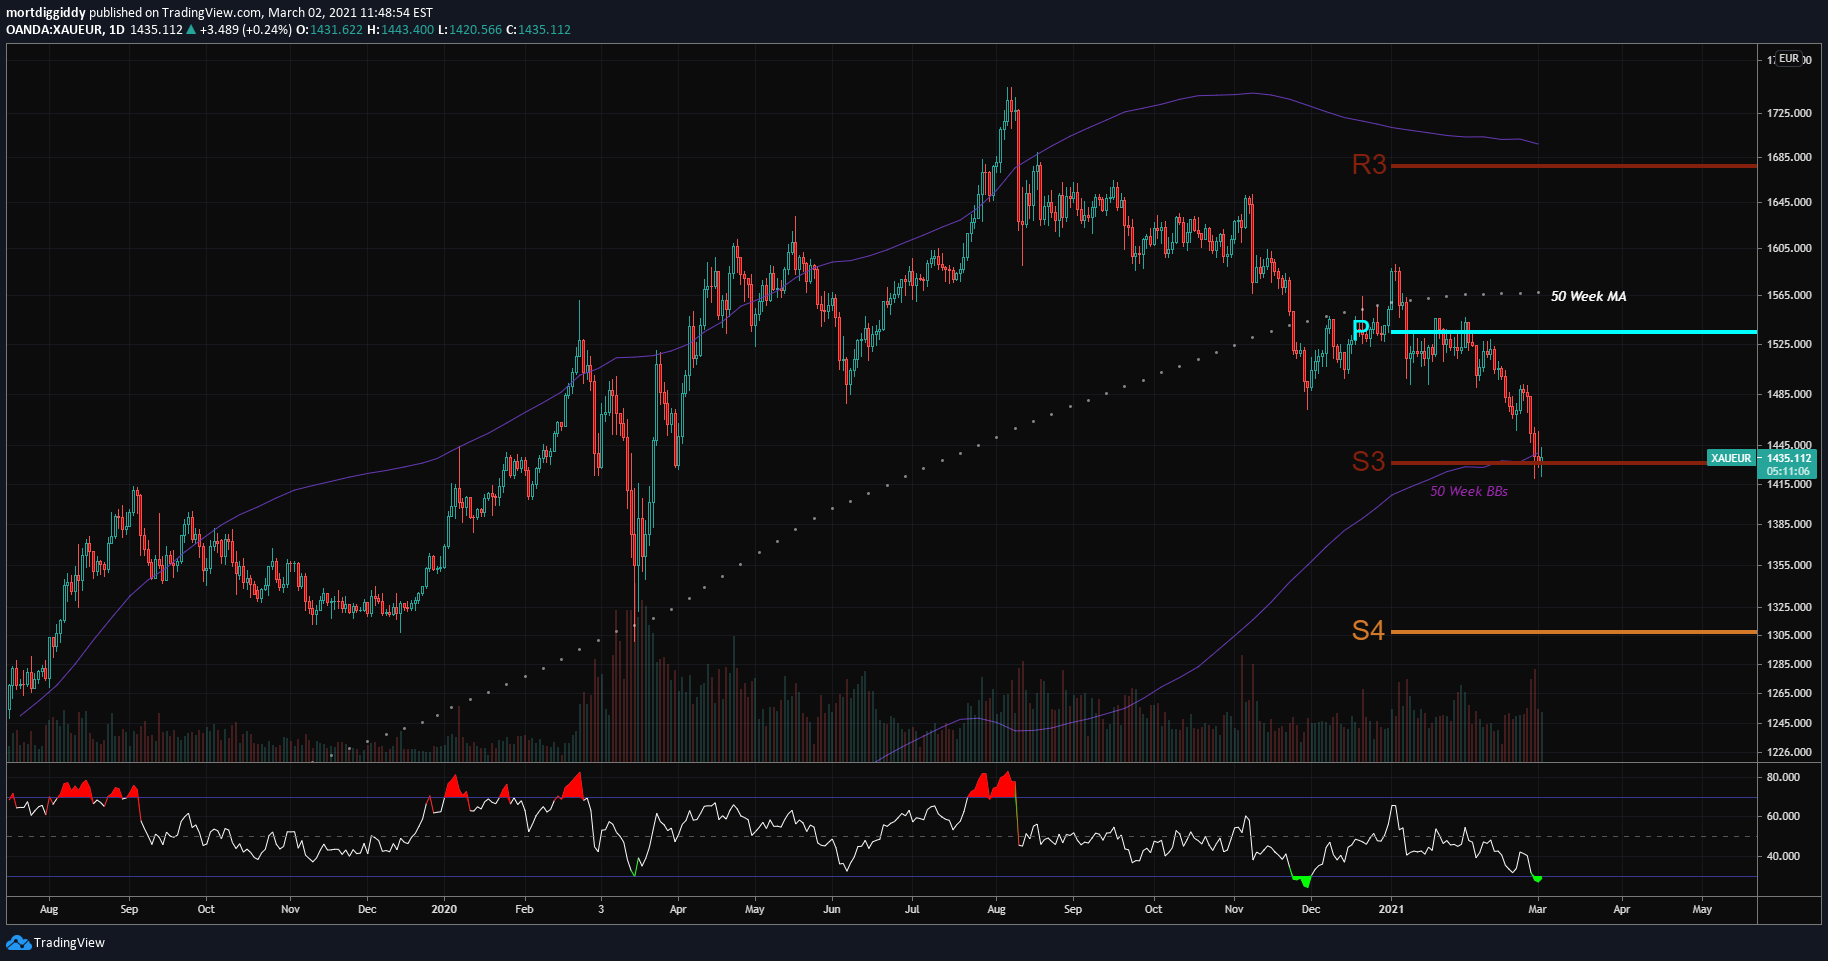
- Year Camarilla S3 Strike
- 50 Week BBs strike, against the dominant trend
- The previous RSI-14 oversold hit in November is showing a possible bullish divergence in RSI. RSI has made a higher low, and the price has made a lower low.
XAUEUR – Week
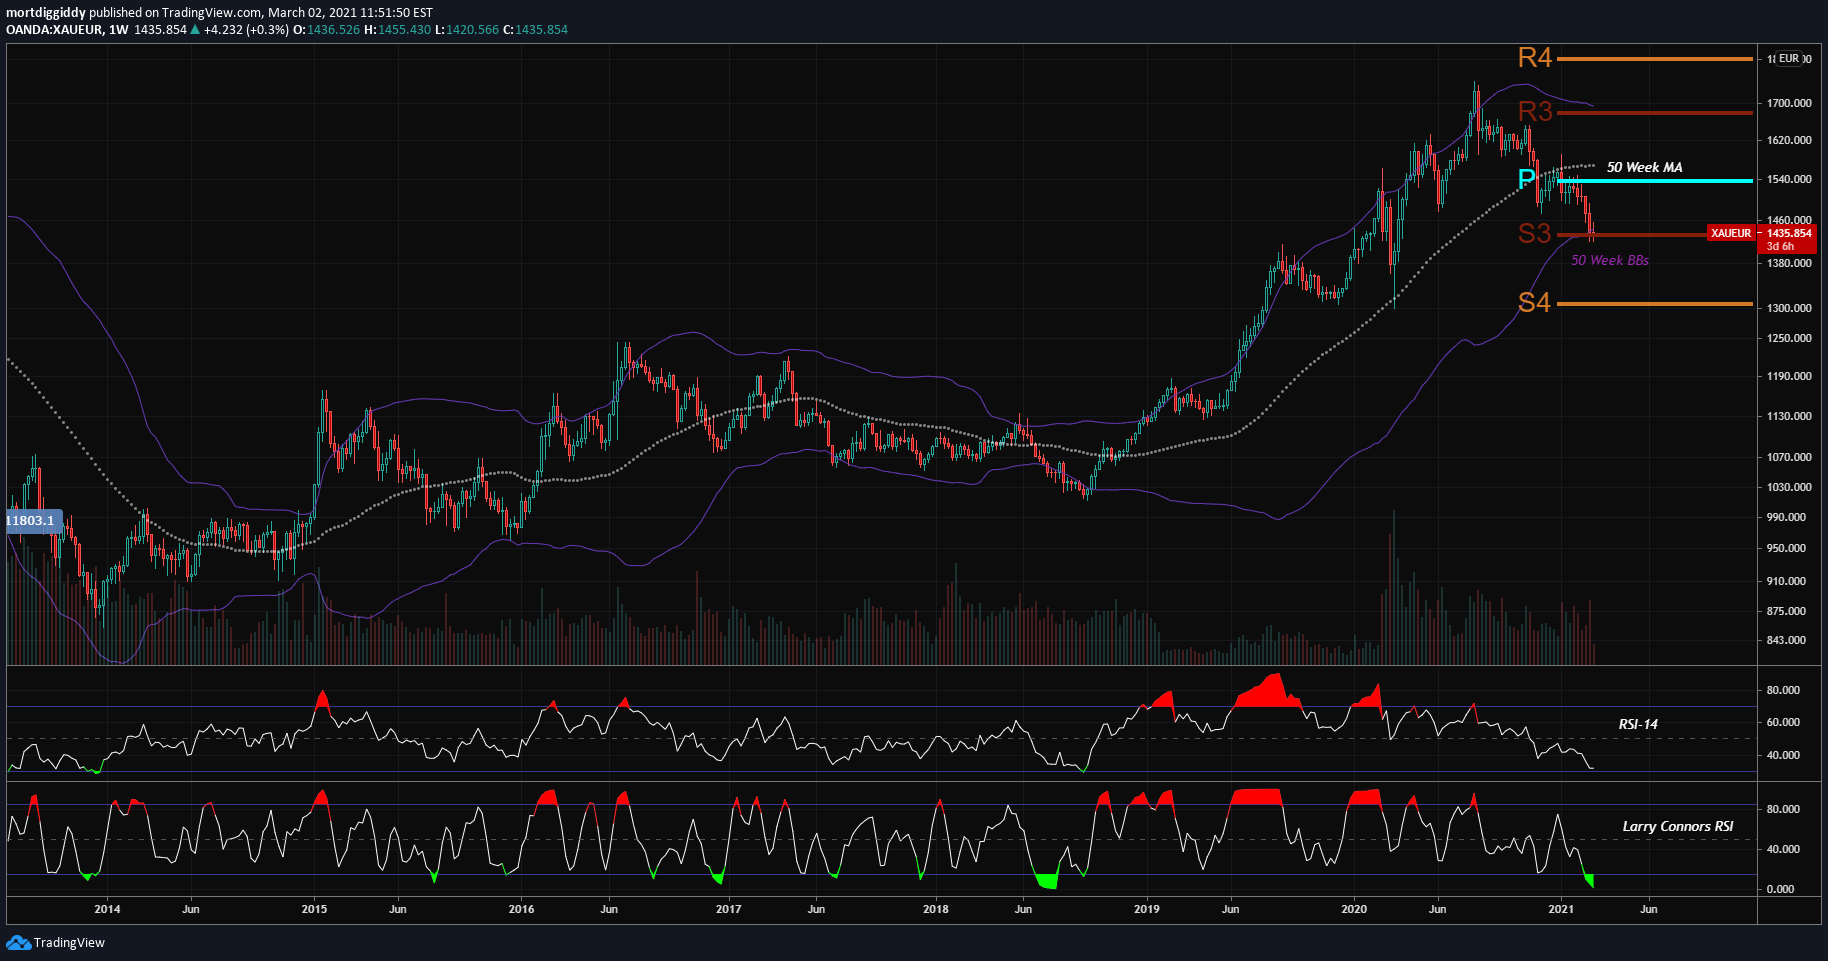
- RSI-14 even on the weekly chart is nearly oversold
- Larry Connors RSI (Discussed in his book ‘Short Term Trading Strategies that Work’) is also oversold
- Seeing the 50 Week BBs is more clear in this picture, the measured move target on these types of BB trades is always back to the middle, the 50 Week MA in this case
XAUAUD – Week
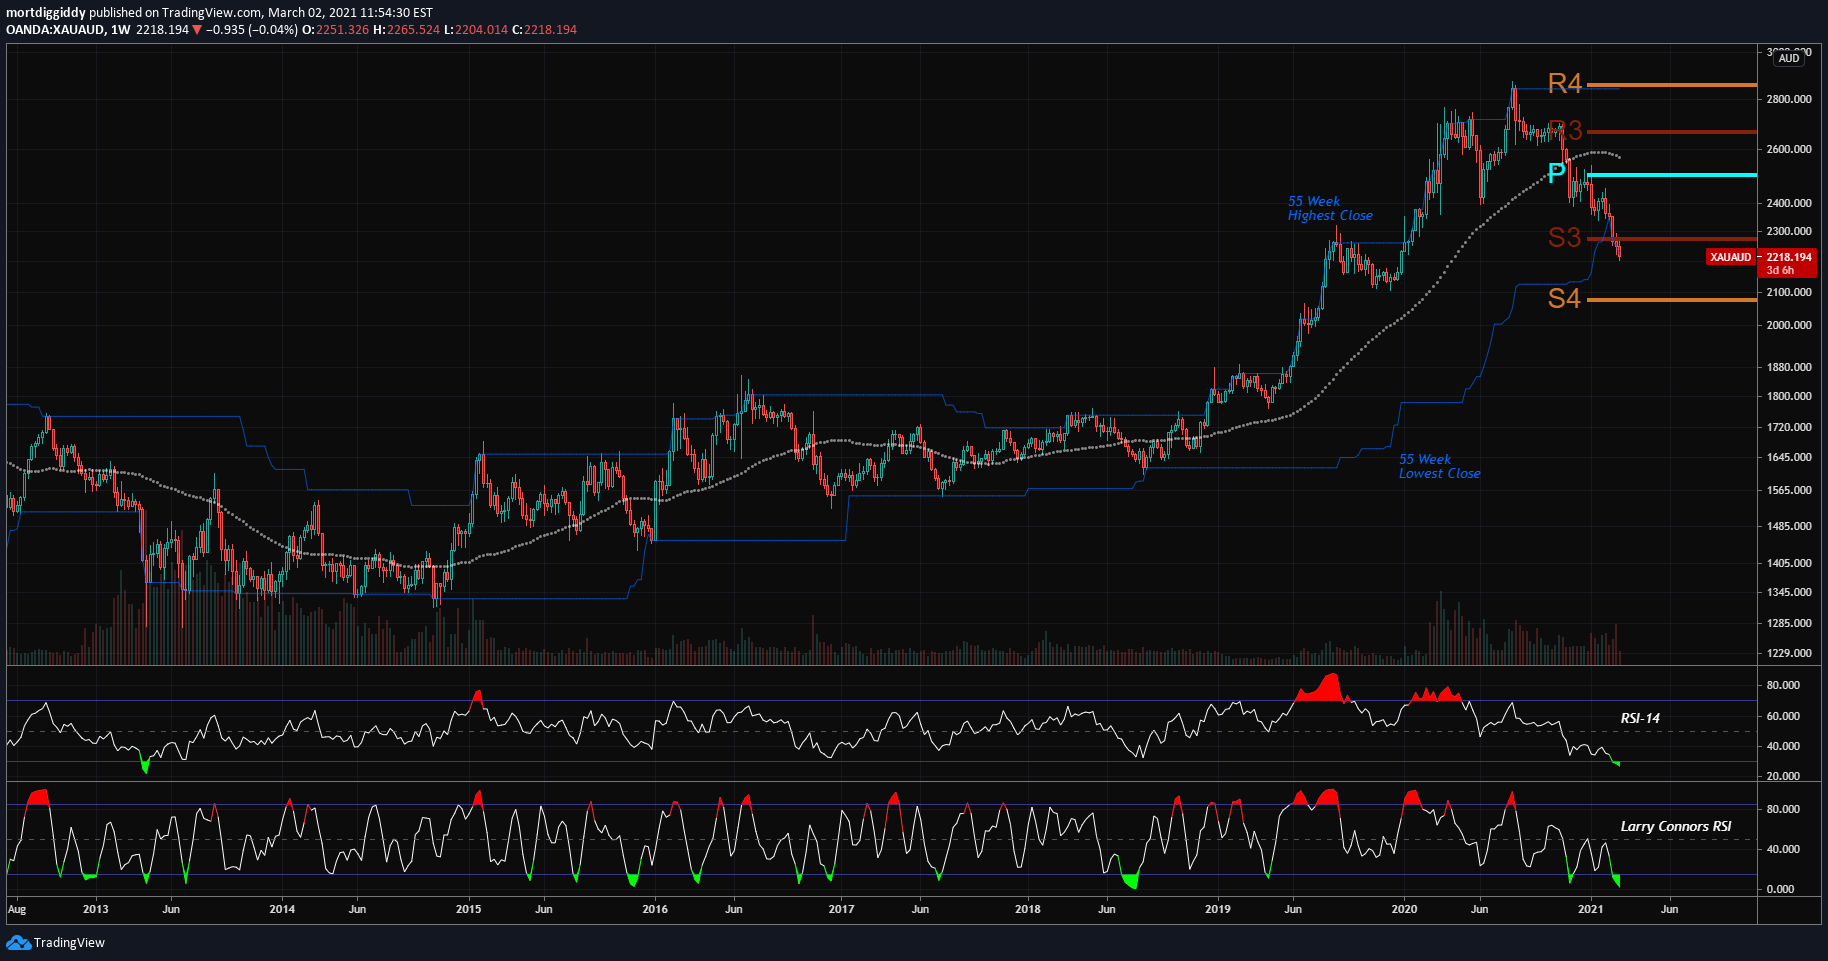
- This is a beauty to me. RSI-14 is oversold on the weekly chart for the first time in nearly 8 years since 2013.
- It has been trending down the 55 Week lowest close, similar to 50 period Bollinger Bands.
- AUD remains super strong with copper so it is no surprise that gold has underperformed
EURUSD Long
Now may be one of the perfect times to get into euros.$EURUSD $DXY $GBPUSD $EURJPY $USDJPY $TLT $GOLD pic.twitter.com/tcia1WseIv
— Cameron Osborne (@dailyEdgeGroup) March 2, 2021
BONDS
As everyone has draw their attention to bonds, I point out that this time of year is ripe for a counter trade.
Seasonality for $TLT attached.
30Y and 10Y bonds are EXTREMELY oversold currently on Week and Month.
10-2 spread huge.$TNX $IEF $DXY $EURUSD $SPY $SPX $NDX $QQQ pic.twitter.com/voqjTQArIY
— Cameron Osborne (@dailyEdgeGroup) February 25, 2021
Great stuff Sir Mort. He explains in a lot of detail and technicals why I look at seasonals for a historical perspective but I don’t just mechanically accept them for actual trading. There are always exceptions and the technical analysis explains what is actually happening now. Thanks.