$TNX Daily, YIELD CURVE Weekly
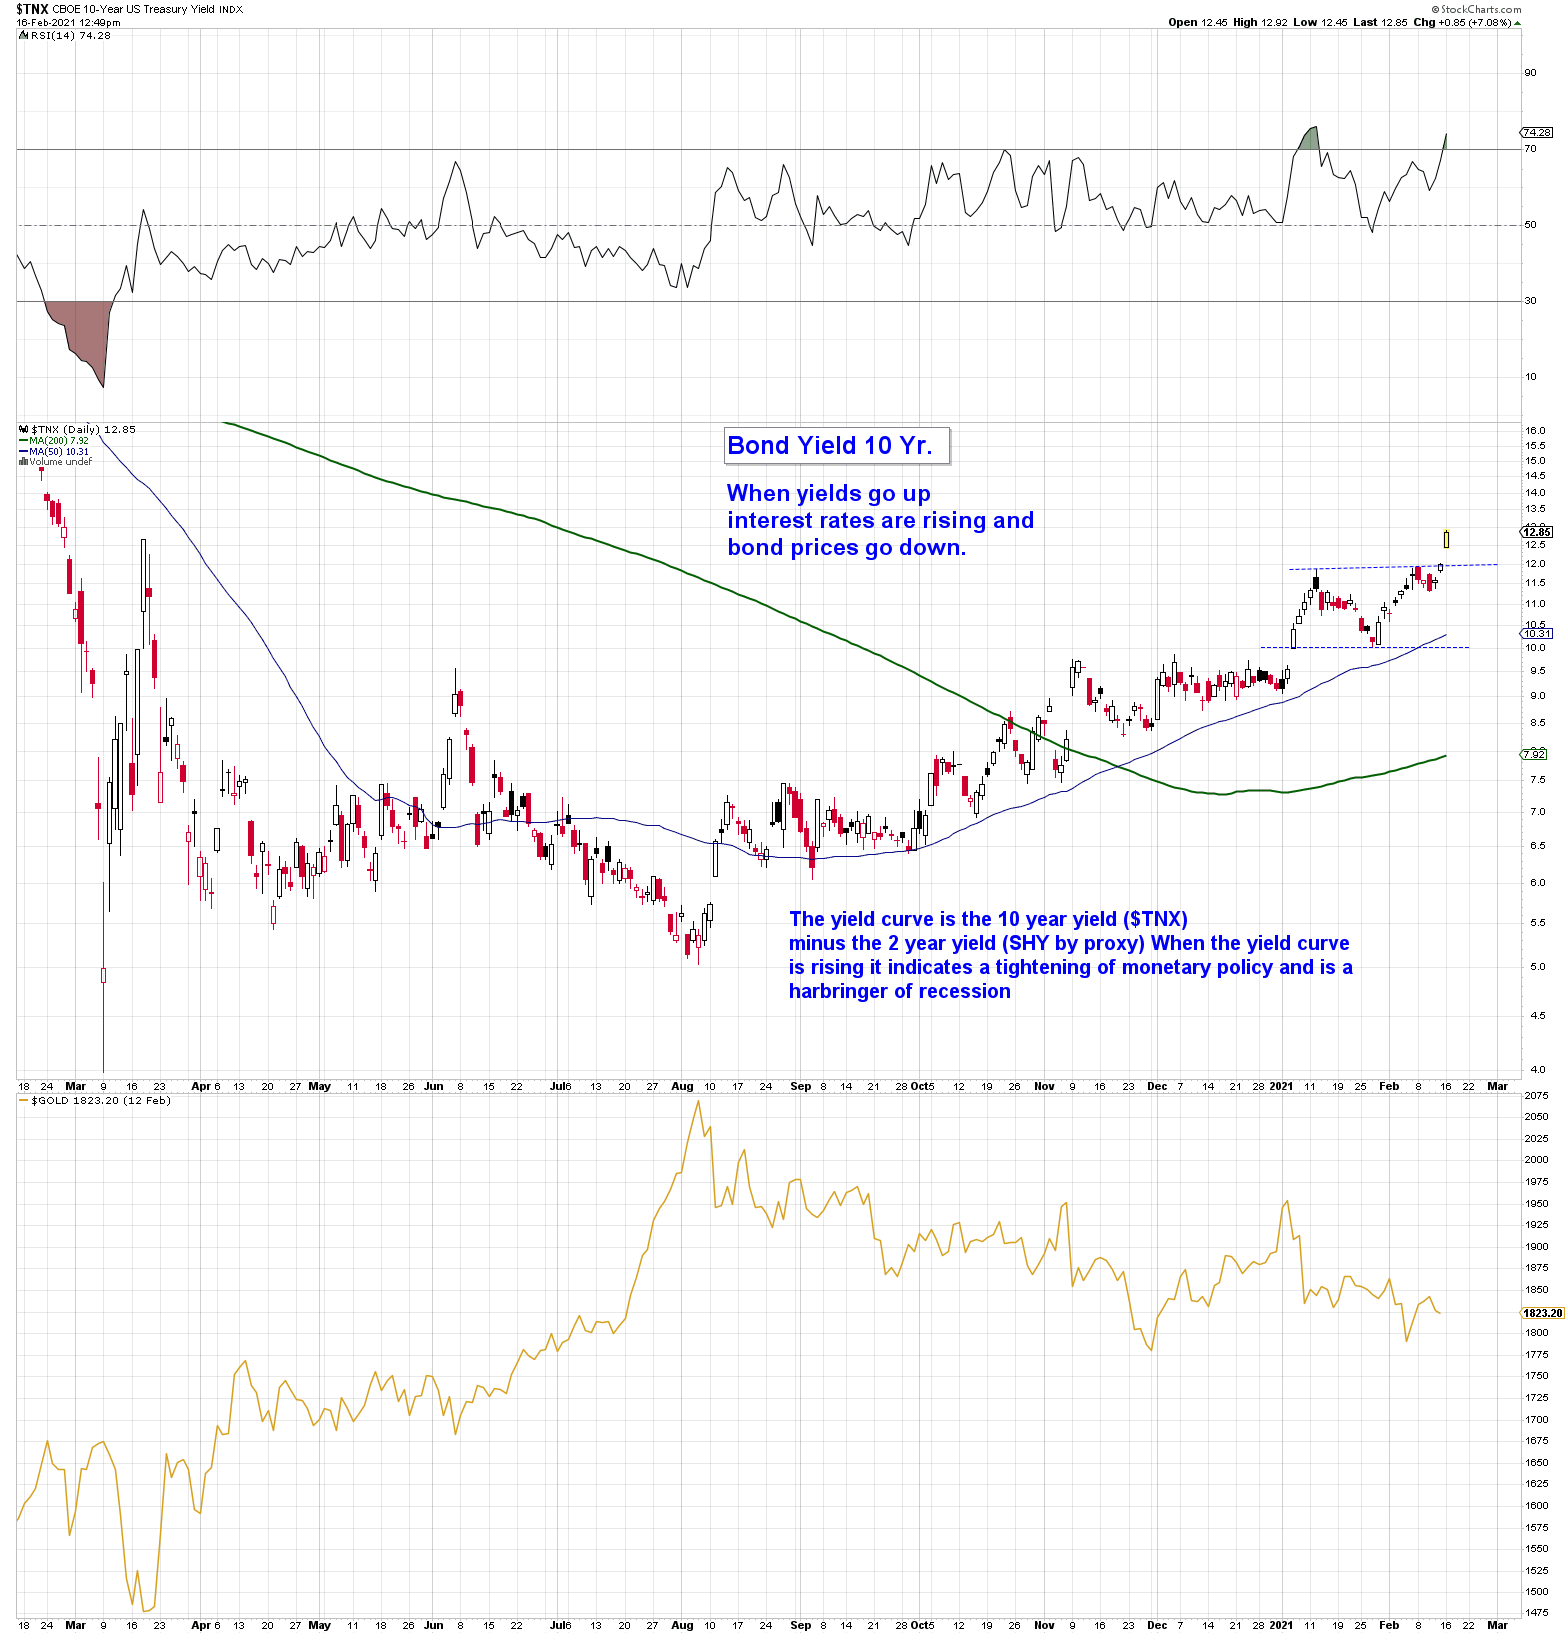
$TNX is the 10 year US treasury yield.
$TNX Daily
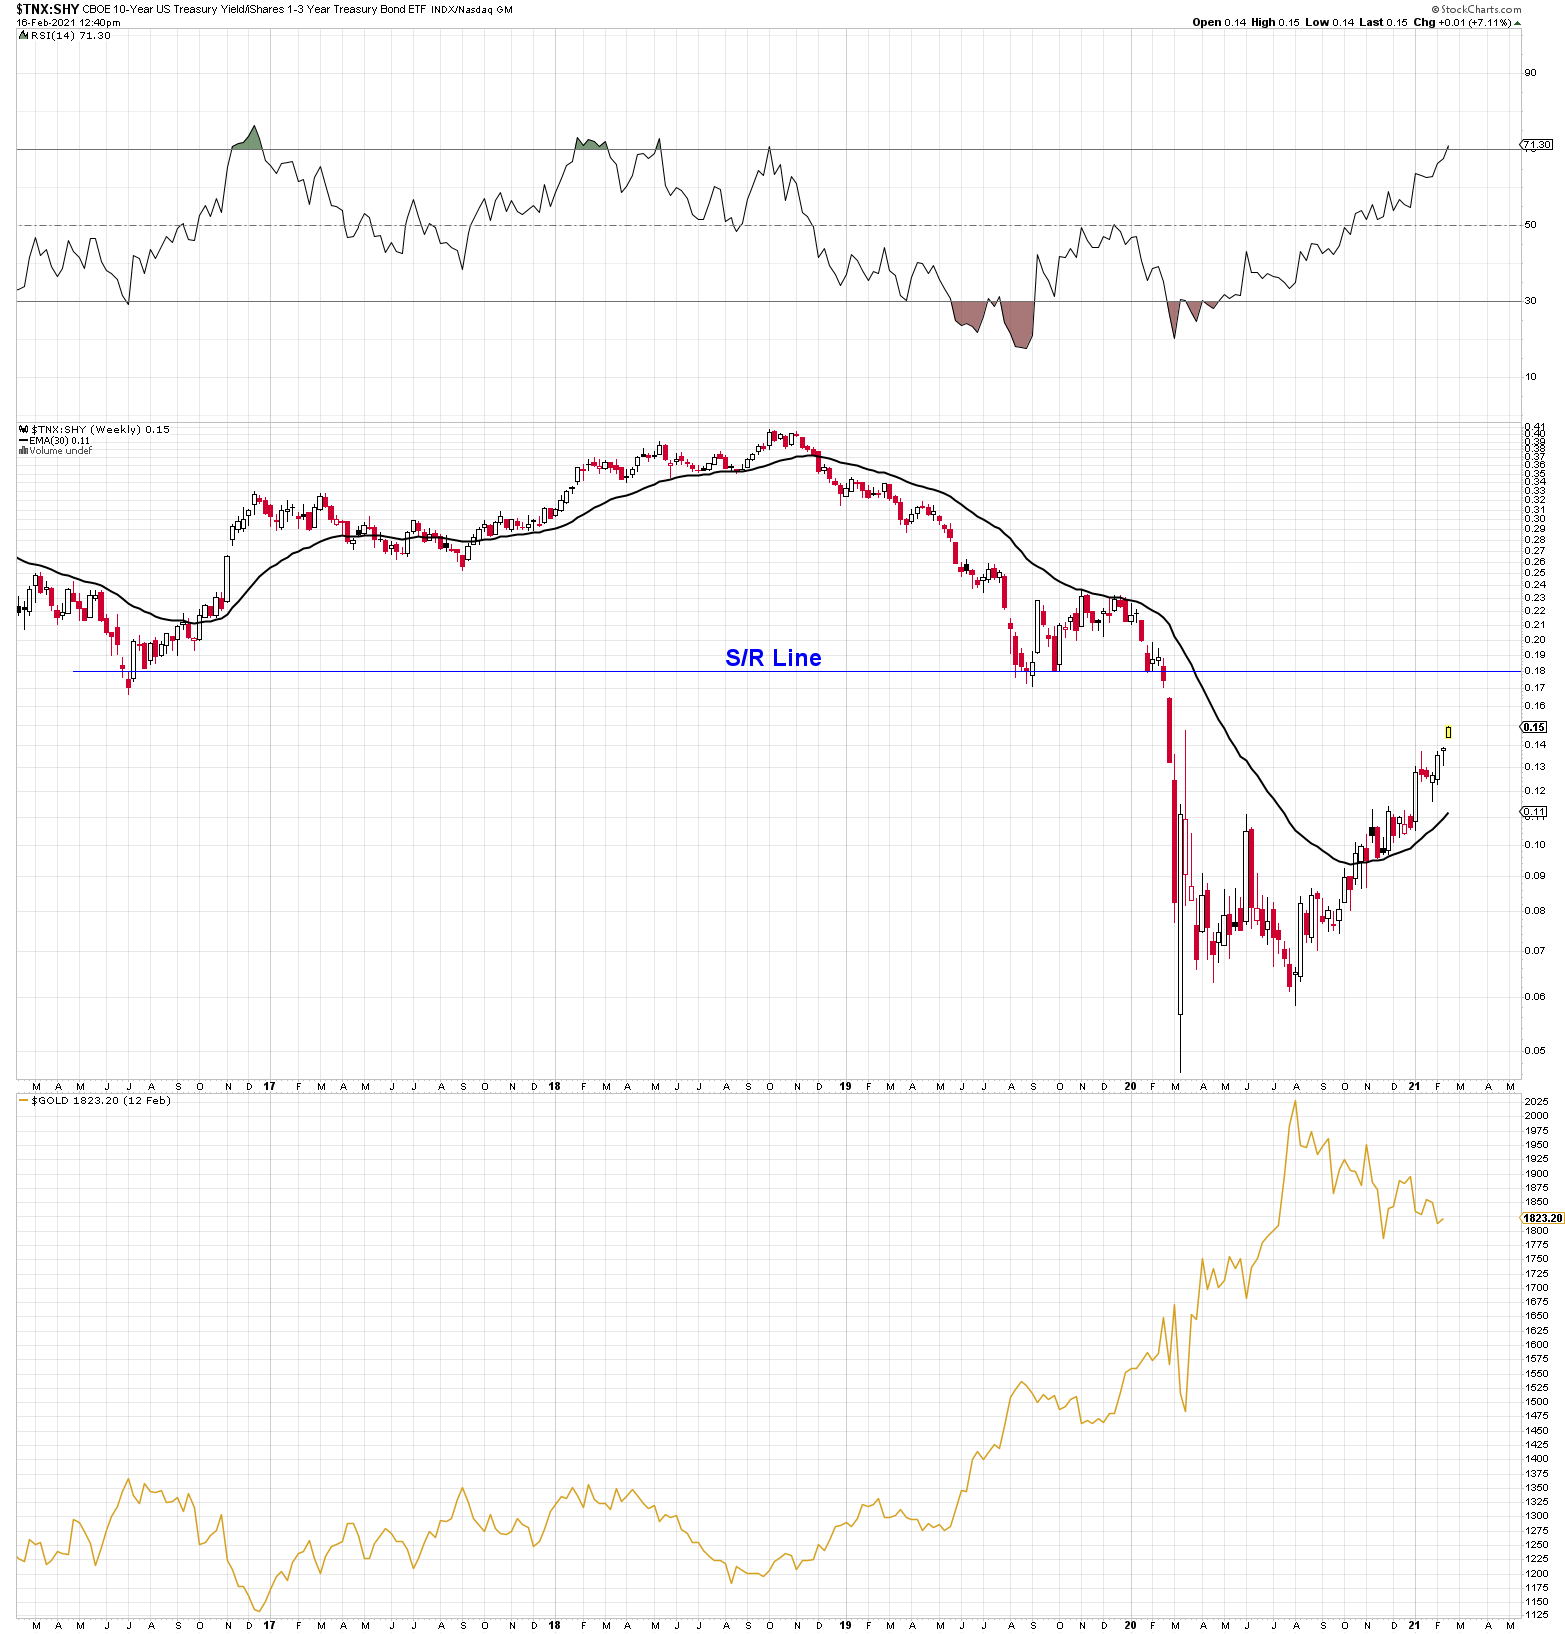
I don’t have a chart for the 2 or 3 year yield so am using the ETF SHY as a proxy.
SHY has been steady while $TNX has been rising, so the yield curve chart looks much like a chart of the $TNX.
(BTW, notice how $GOLD has been inversely tracking $TNX)
YIELD CURVE chart – Weekly (Not a true YC chart, but the best I could do.)
Notice today’s gap up in interest rates and in the yield curve. Consider that $SPX as a percent of GDP is at all time highs. Margins as a percent of GDP are also at all time highs. So the most over valued market in history is also the most levered market in history. Retail investors are “all in.”
The question is, at what point is the stock market going to throw a hissy fit about rising interest rates? A break through the S/R line at 0.18 on the yield curve chart would be a good guess. If a serious correction happens investors will sell anything and everything, including Gold, to raise currency to meet their margin calls. I don’t say a crash is definitely going to happen, but it is possible, maybe probable. Be careful out there.
Great post, SF.
These pressures and “….sell everything including gold….”, in addition to sentiment – 9 month H&S formations in paper gold (GDX). I believe we are going to get a nice spike down buying opportunity for paper metals before the quarter is out (possibly into May). Thanks SF !
I had seen some charts where in the recessions the dollar goes up, makes sense as the general markets run for cover. Although Japan and Asia all plugging along nicely and using the commods.