Stepping back for a look at the EURO and the DOLLAR
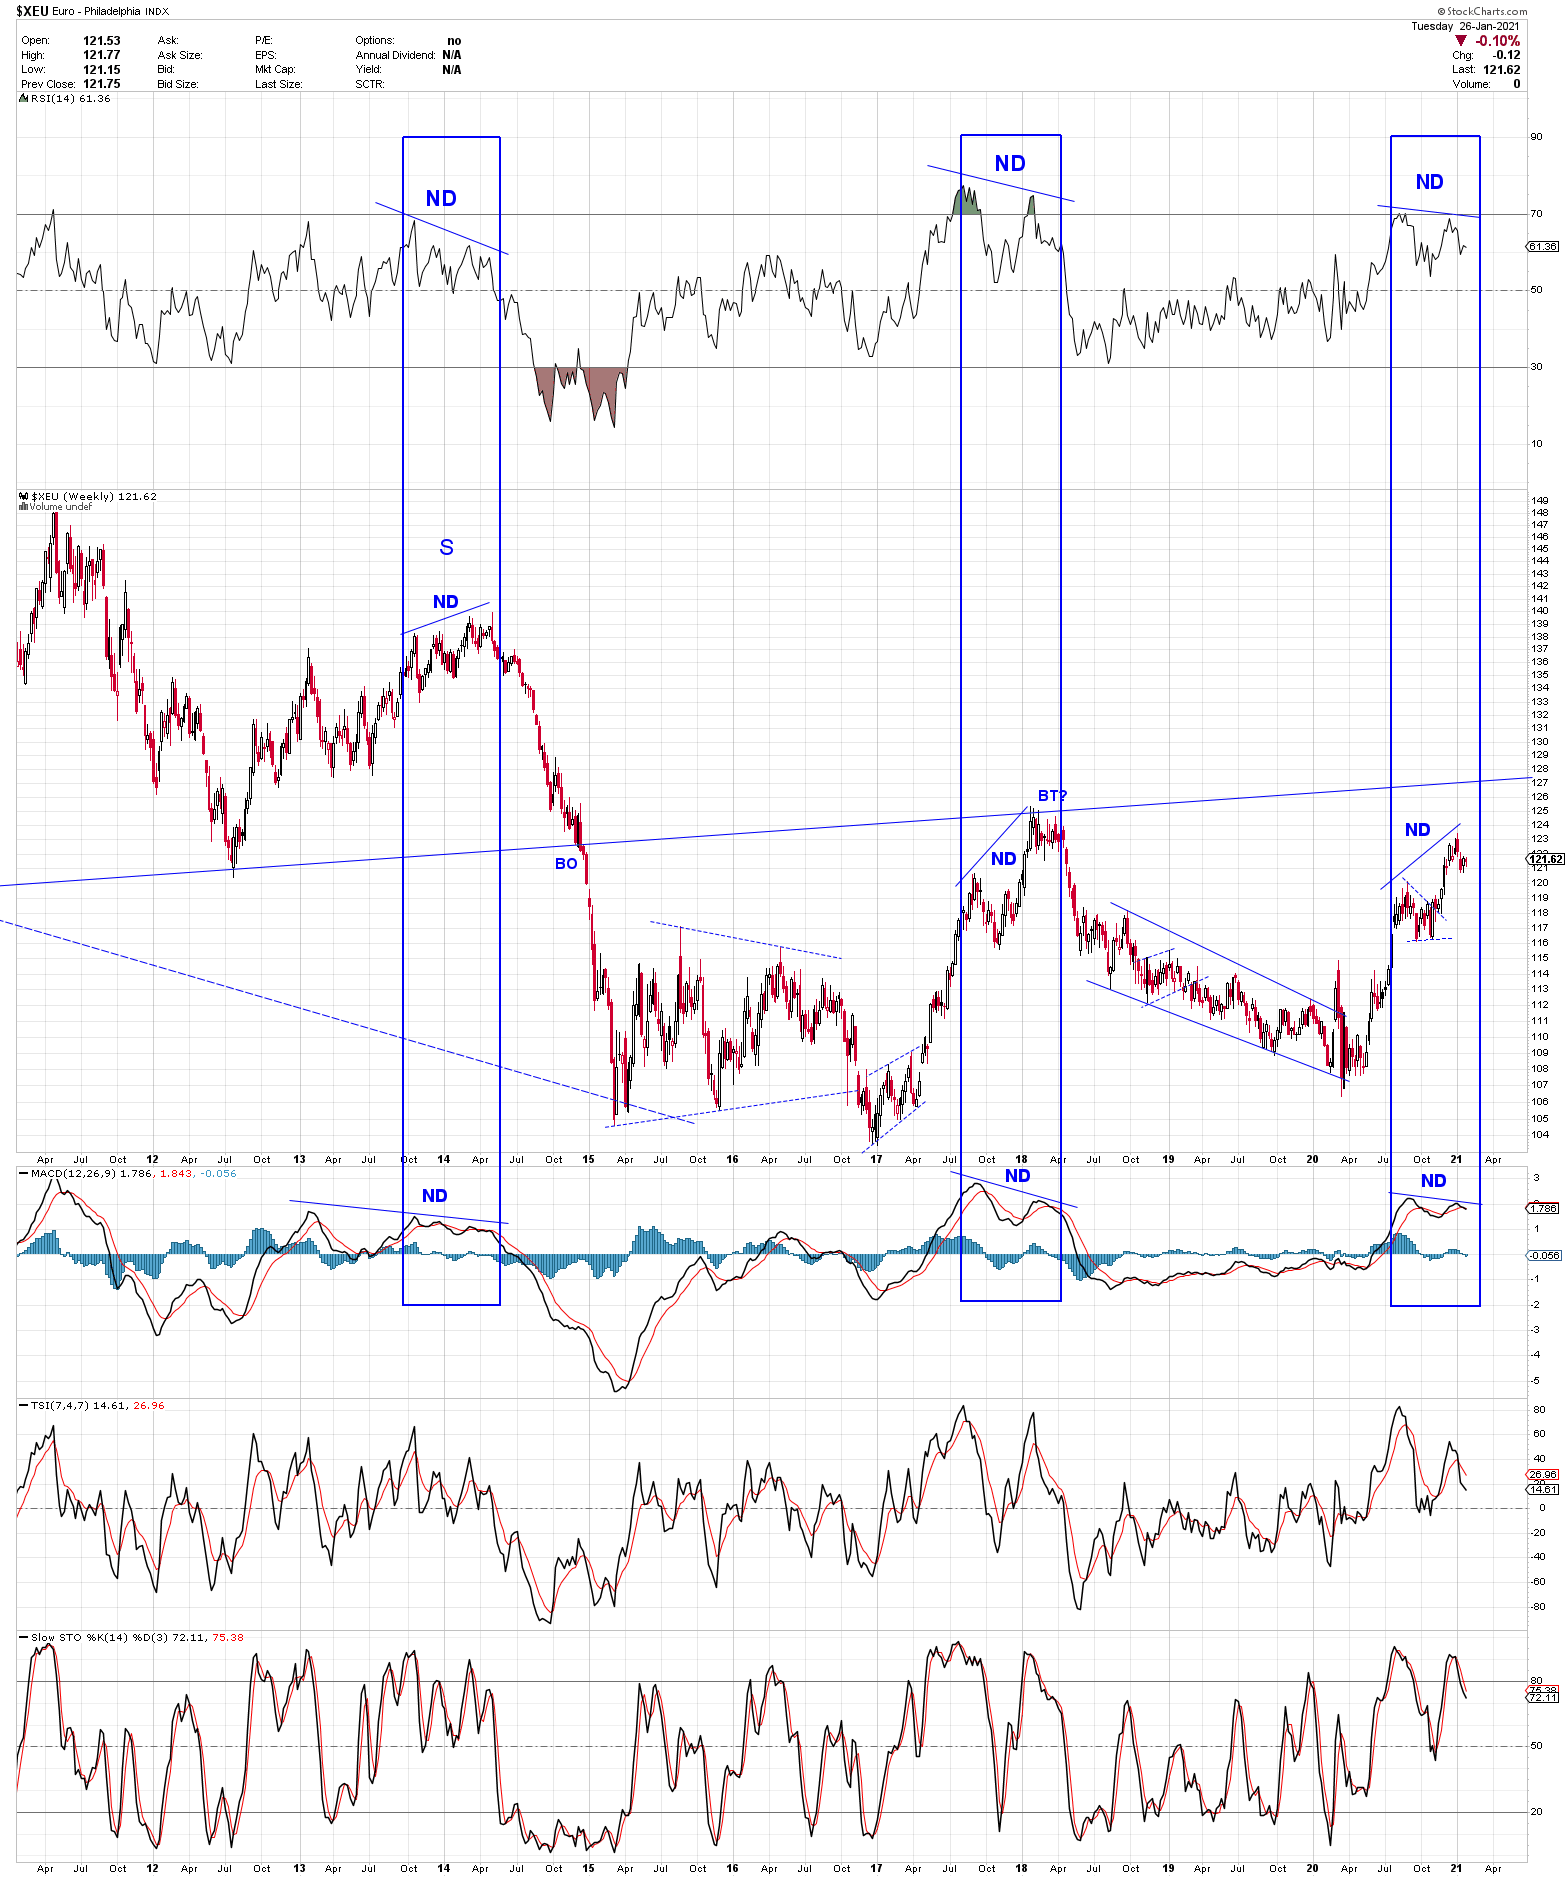
On this weekly chart of the Euro looking back ten years there are three divergences to price where the Euro made new highs, but the RSI and MACD did not (Negative Divergence) Notice the decline in the Euro that followed the Neg Div of early 2014 and and early 2018. The third Neg Div is underway in early 2021.
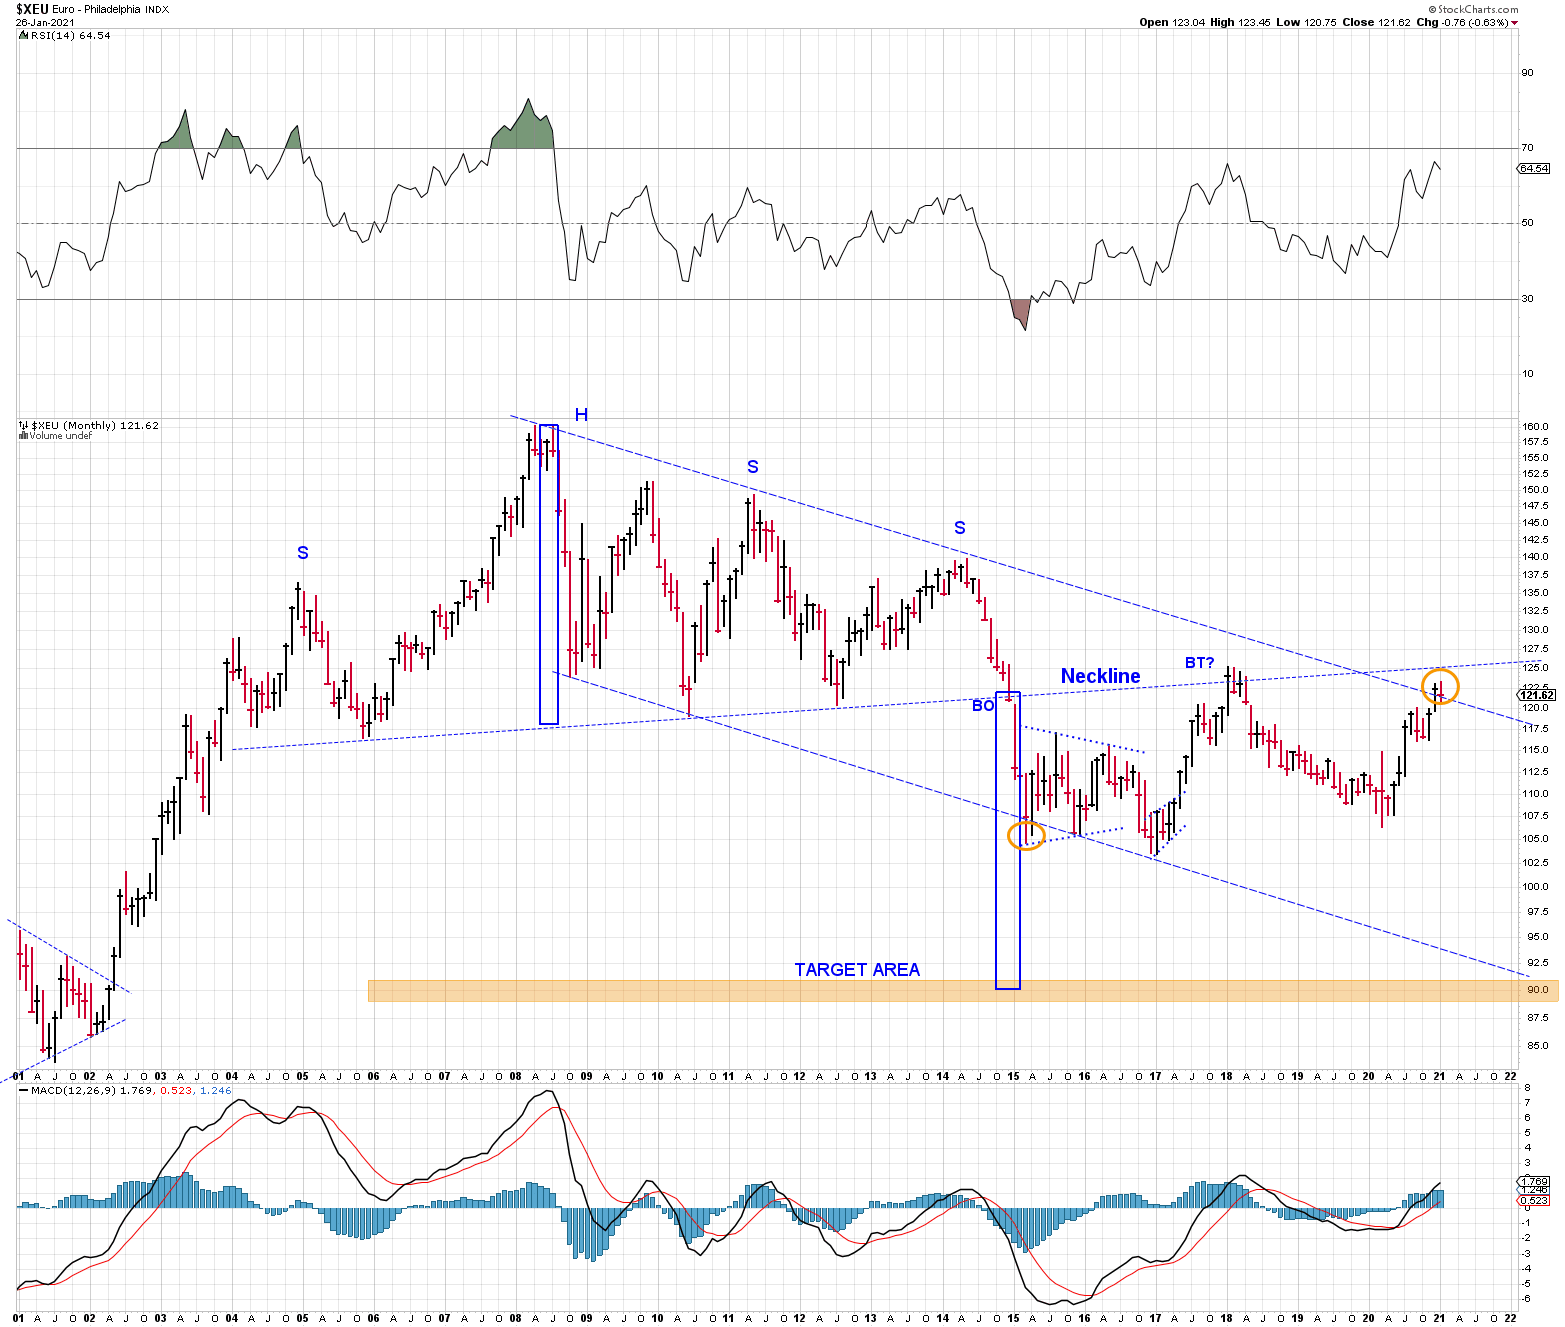
In this monthly Euro chart the SHS pattern stretches for 11 years, from and including 2004 until late fall 2014. Assuming the SHS is valid, notice the target area has not yet been reached. Also notice the symmetrical breakouts of the top and bottom rail of the descending channel.
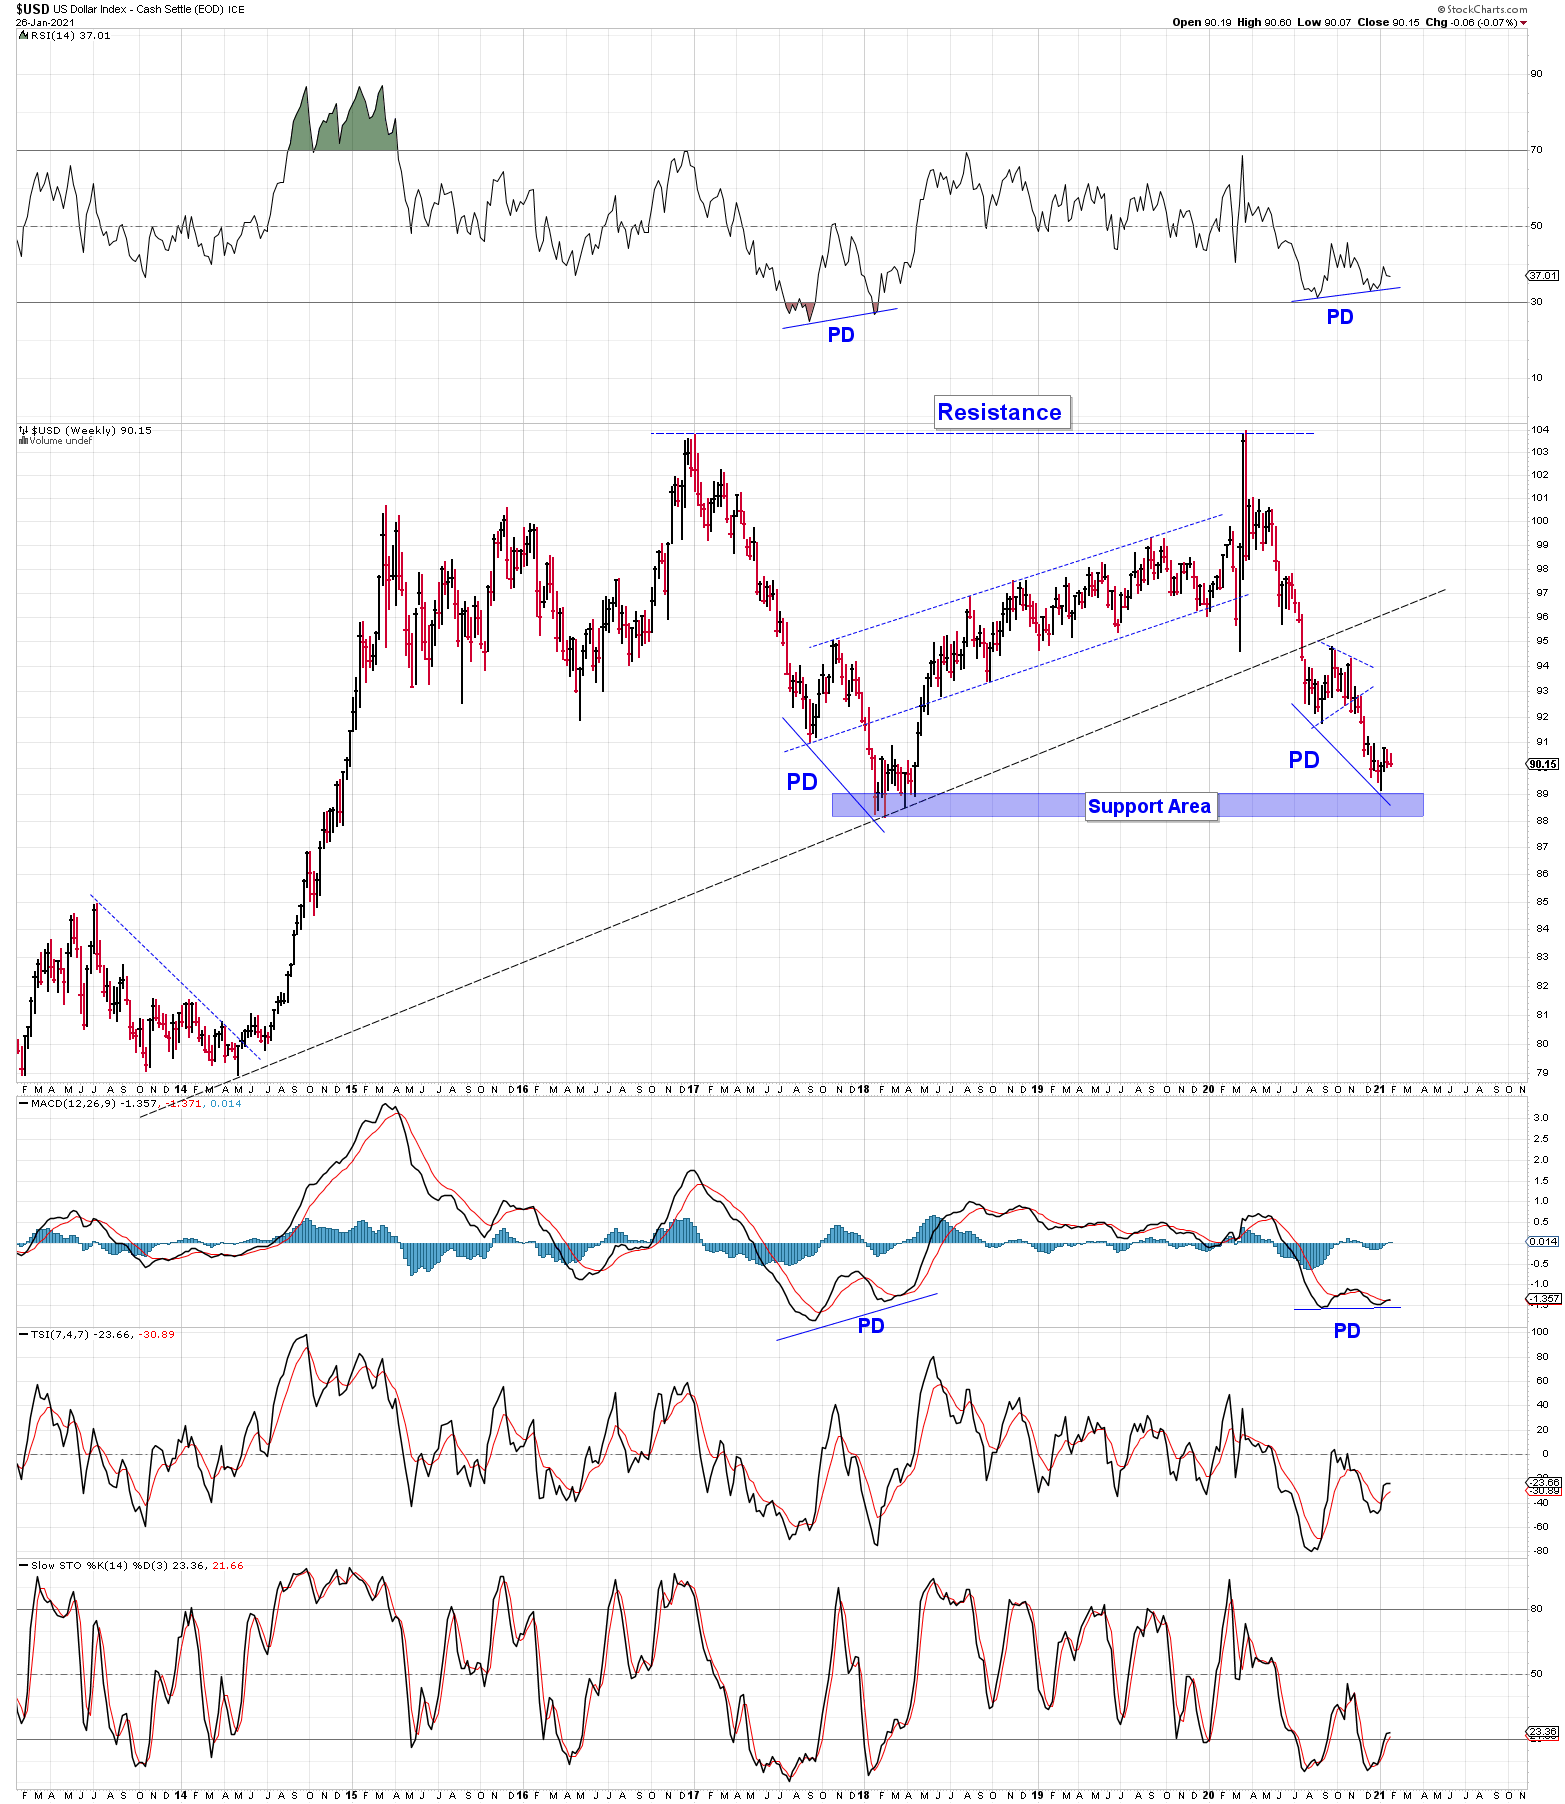
If there are NDs to price on the Euro weekly we expect to find positive divergences to price (PD) in the Dollar weekly chart.
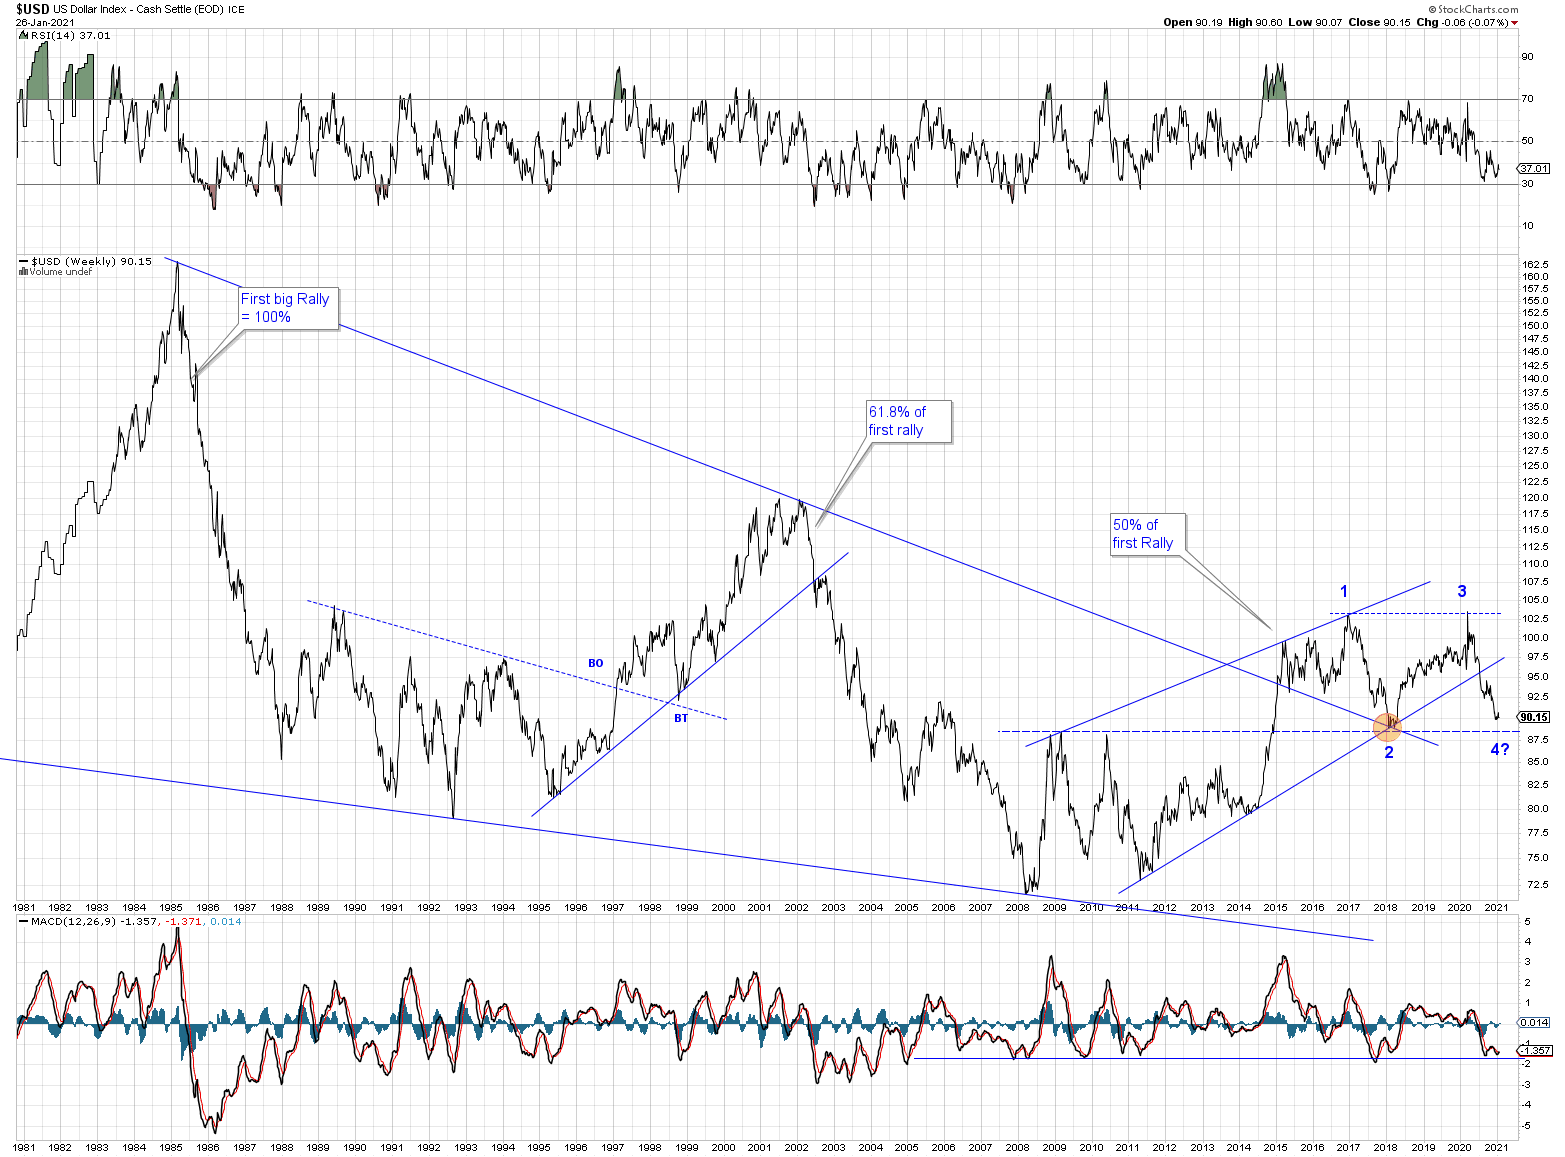
On the long term Dollar chart (below) the 2020 breakdown could be a consolidation, or continuation pattern to the upside. BTW, the Dollar Fibonacci rally sequence on the chart is an idea proposed by (Parabolic) Chuck “yearons” ago. It is interesting, and it remains on the chart until proven otherwise.
Conclusion: It is not unlikely that a Euro decline gets underway soon. If so, and since the Euro and the dollar are like two kids on a teeter totter, a corresponding dollar rally would happen simultaneously. A rising dollar could cause a world drowning in debt to implode. Another deflationary panic is possible, probable even.
Impressive presentation!
Great story telling with the charts and thanks for the shout out Silver fox!!
These consolidations stink. Who would have imagined this slow motion sideways action would last so long.
Oh my goodness, PC. I thought you had flown off to find other interests. Nice to see you’re still with us.
Yeah, this is a tough one. Some PM stocks (explorers) are holding up nicely. Others – even solid producers – are breaking down.