Is Rambus Saying Roaring Bull Market?
This chart suggests we are at or near a top:
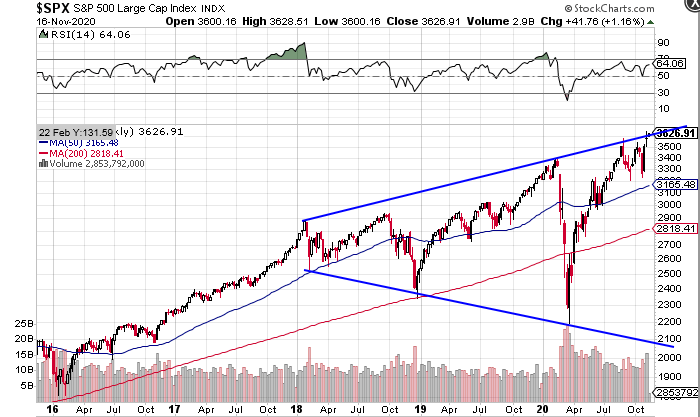
Is Rambus suggesting that instead of a crash to 2000 or so on the SPX, we are instead going to see the opposite, with a potential rise to 5000, based on measuring the difference between the bottom and top of this pattern, and adding same to the top as an explosive breakout?
A simple Yes/No will suffice.
Or maybe we get the crash to clear out the Robbing Hoods, then a resumption of the bull market?
Who’s in charge here?
Fade Rambus at your risk
https://goldtadise.com/?p=417700
I agree. That’s not a top you have there Avocado. The charts have plenty of room to run yet. Which does not mean they can’t correct as they go there. On the other hand I still harbour some gloom genes that imagine a a bad outcome under some circumstances. There was a time I believed charts were almost fixed in their structure and anything could be predicted. But that did not pan out. Charts are structurally sensitive to changes that happen as time passes and sometimes we cannot be sure of a price move until literally the moment arrives because they are case-sensitive in how they are drawn.
I am able to put a line on a chart and know we broke out though. On November 9th the NASDAQ put up a candle that ended any doubts we might have had. But the chart had already broken out higher way back in August 25th. It did not matter than it corrected 6 days later. The important piece of information we needed had already been posted. So we could rely on that to know with certainty that any dip should be bought.
Likewise, the Naz reversal bottom at 10,945 on November 2nd was the last time the chart was at risk. Had price closed lower on a daily basis it would have resulted in quite a lot of automated selling. That’s what I mean by case sensitive. The very moment price arrives at a certain point the decision becomes binary as to whether you stay in or get out. But nothing bad happened fortunately so we will live to see much higher-highs in markets.
For now, treat the low points on the daily chart that came on September 23rd and November 2nd as two points that form an effective double bottom (even though its kind of on an angle). But those points are quite bullish supports. These index charts can and should be bought. When the Naz posts a close above 12,228 we will have another confirmation of the bull trend. It may reverse modestly from near that level first though but you can probably live carefree for now.
Interesting and informative view Farmer
Thanks
Welcome.
All that being said though. We have arrived at one of those binary moments. There is a reversal point from 12,101 on the hourly chart that I would sell right now as there is potential for a 300 points move down tonight. And if that breaks then anther 300 points after that. Just rough numbers here. Doing this by eye alone at the moment.
Basically the Naz is building a bullish narrowing pennant as it consolidates sideways on the daily chart. It really looks like a positive set up to me. But its going to take time to finish building so its not that exciting at the moment unless you are playing the emini swings.