Golden Doodles

1 Year Daily Chart is Interesting
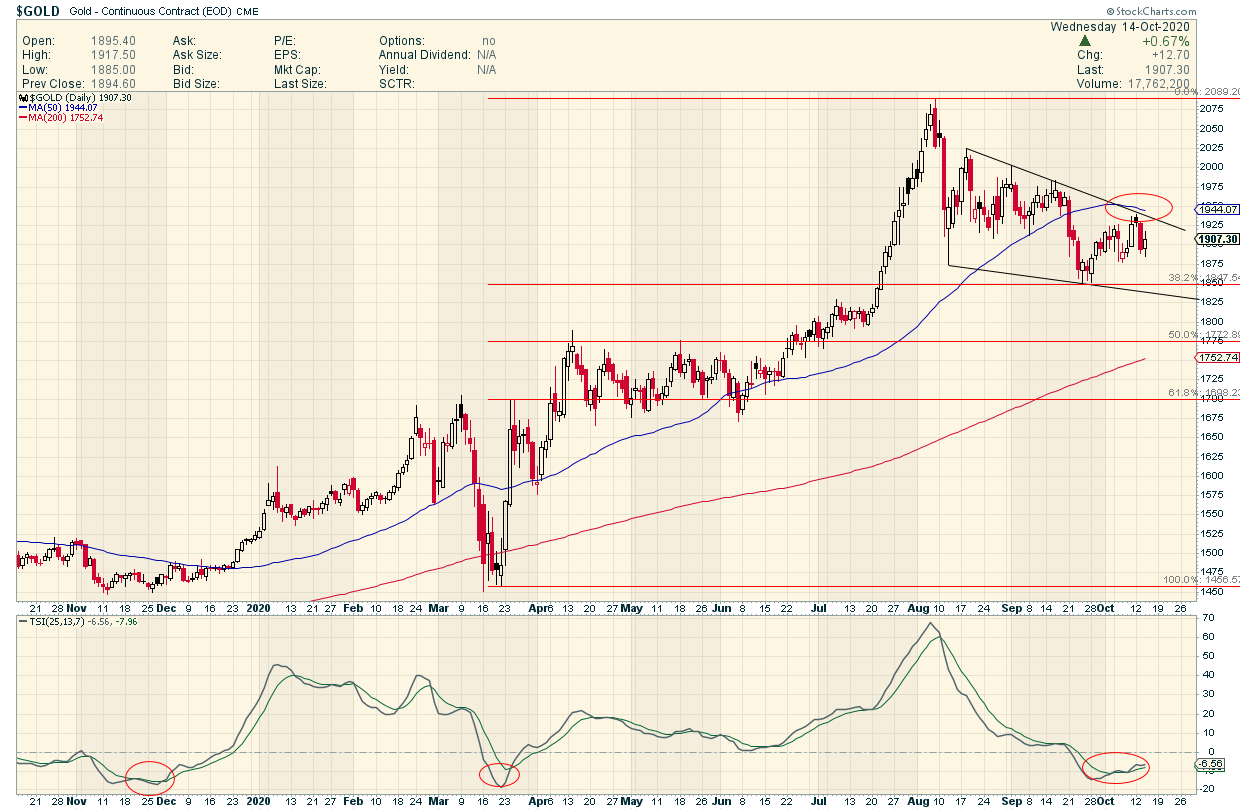
1….50 DMA turning down.>> Bearish
2….Flag…looks like short term trip to the bottom line…from there could take off up
3….TSI at Rock Bottom >> Bullish
4….Direct hit on first Fibo already hit
5…The 200 DMA is rising and will intersect at the 50% Fibo a week before the election
This is around 1775 and is also rock solid horizontal support and worst case scenario if we for some reason NEED to have a deep washout. ( I don’t think so…based on the TSI )
6..The most striking thing to me …that huge run up… $300 happened in all of 2 weeks…and I can hardly remember it.
The most striking thing to me …that huge run up… $300 happened in all of 2 weeks…and I can hardly remember it.
Definitely Short-term Memory loss FGC!