$Silver, $Gold
Not sure about these charts.
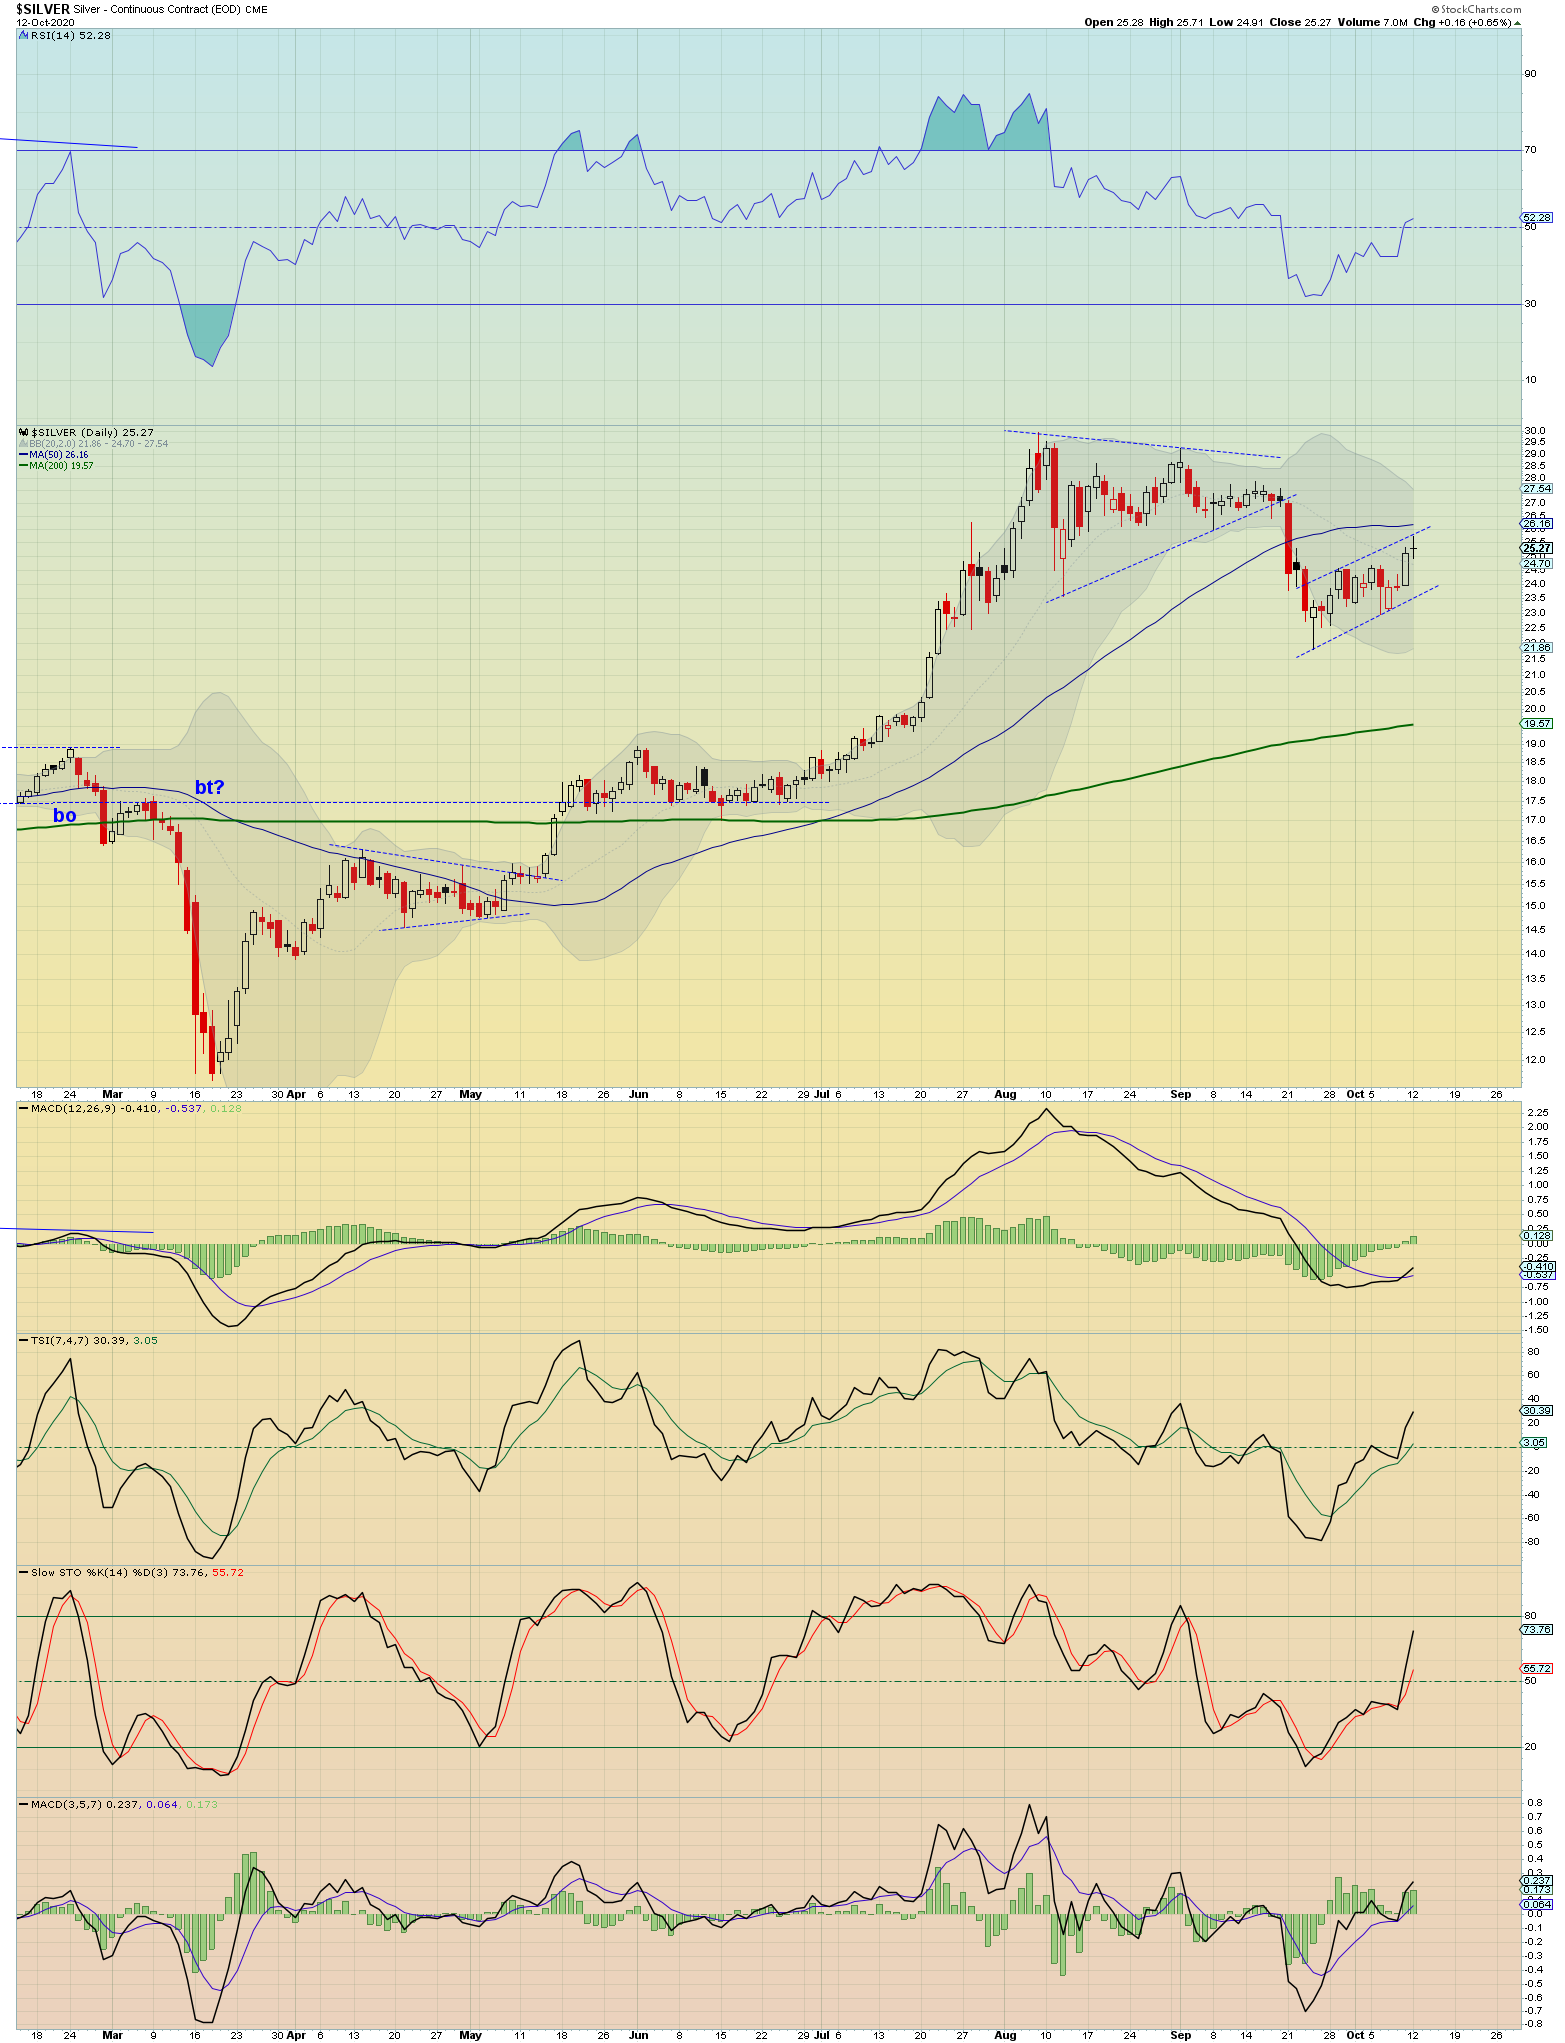
It looks like $Silver is in a bear flag testing the 50 Day SMA from below. If the BF breaks down the price objective is about $21.
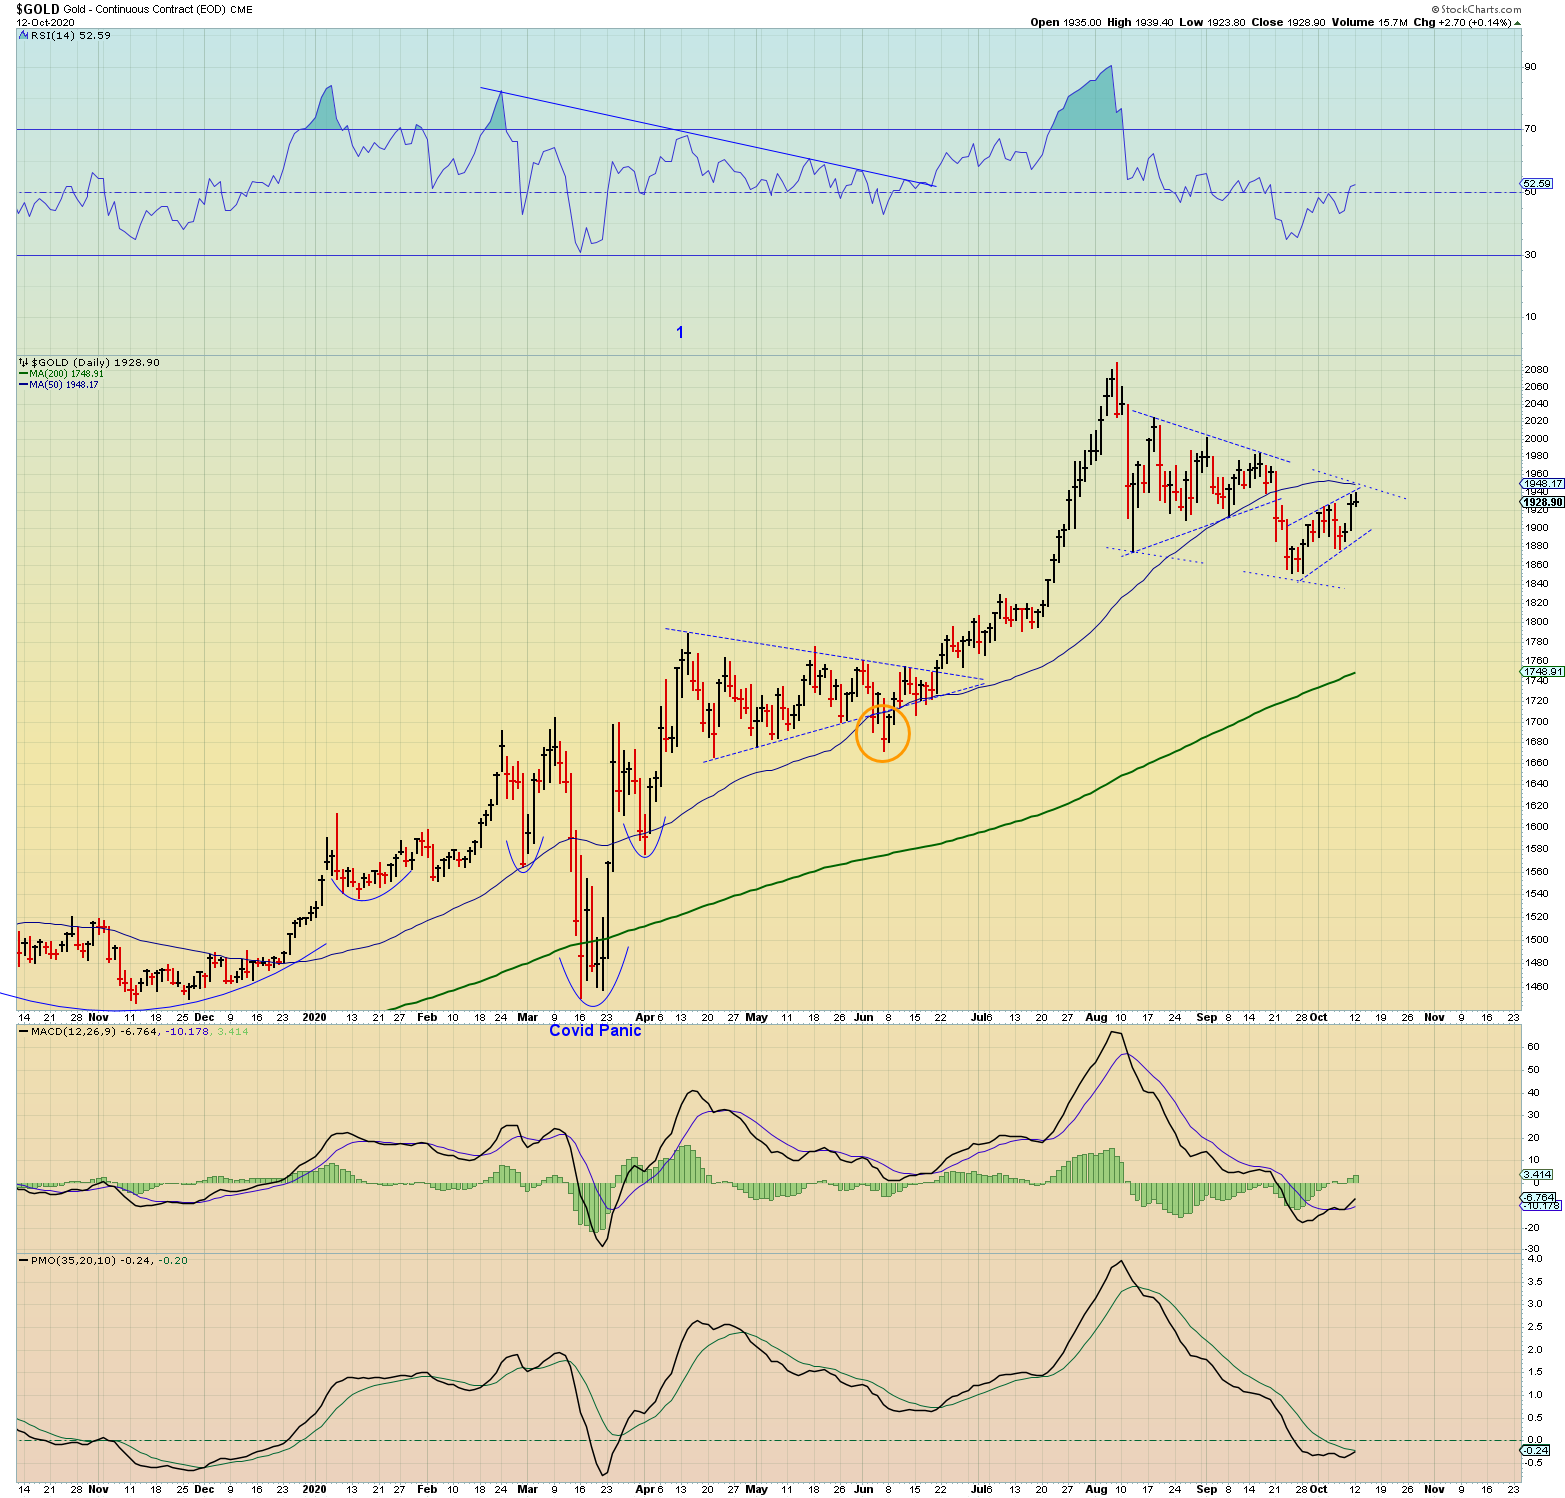
$Gold also looks like it could be in a BF testing the 50 day from below.
$Silver Daily
$Gold Daily