Be prepared for pain
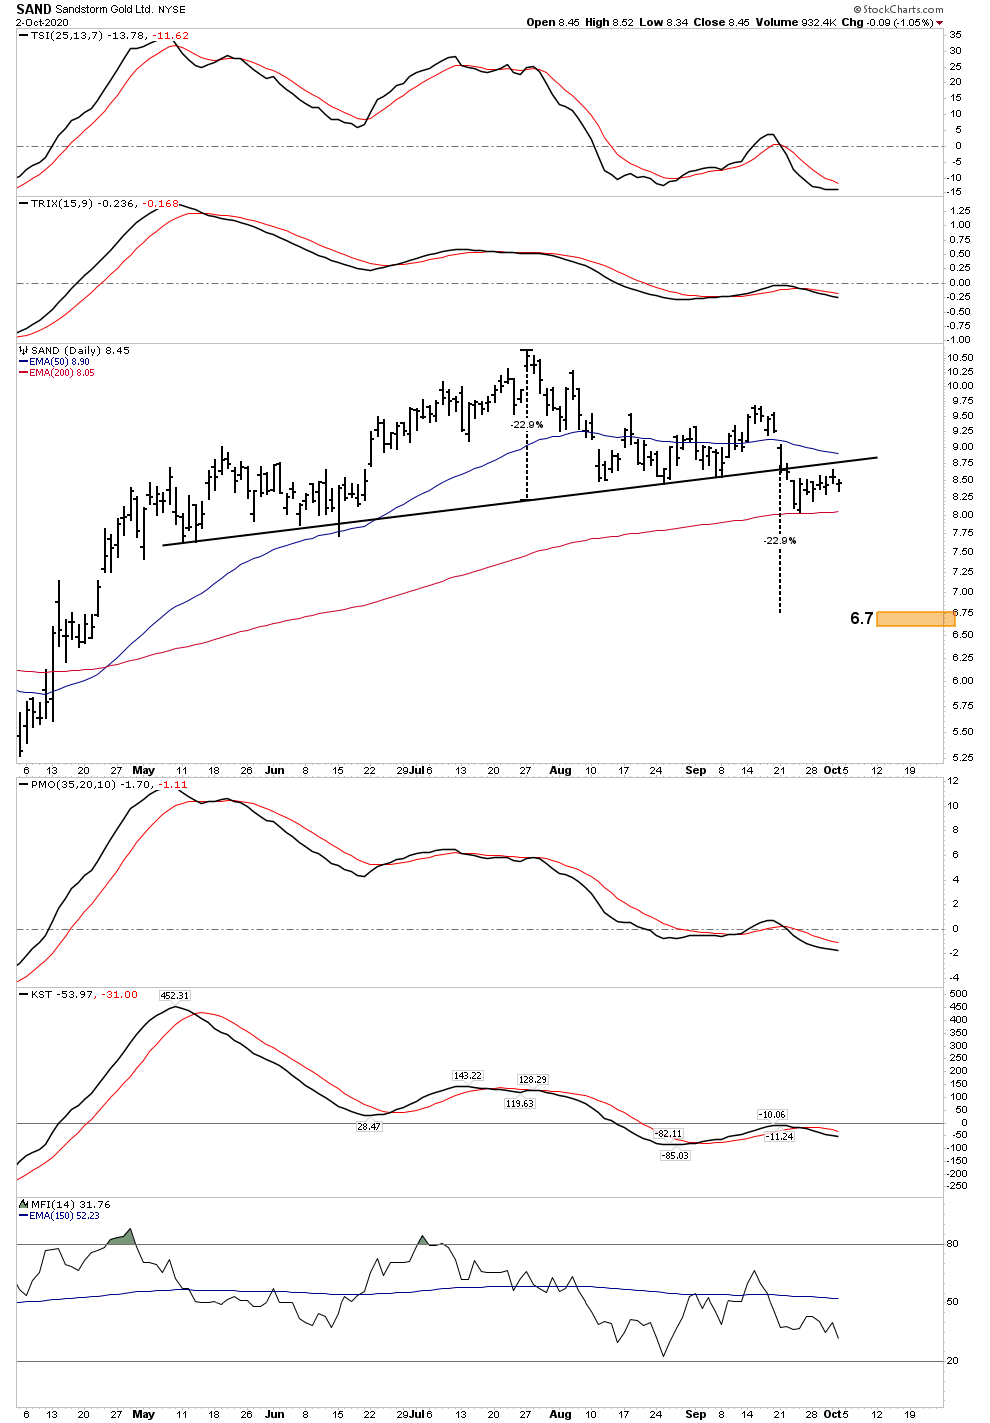
This secondary reaction likely has further to flush out
Over at the Rambus site I also posted the below chart with commentary. Again the theme is Pain! When I scour the landscape I keep running across these charts that are signaling downside price objectives that boggle my mind. How do I make sense of them? Well the market will explain it in due course, however my pea brain says economic contraction or some type of dislocation
You make a good case Sir Plunger
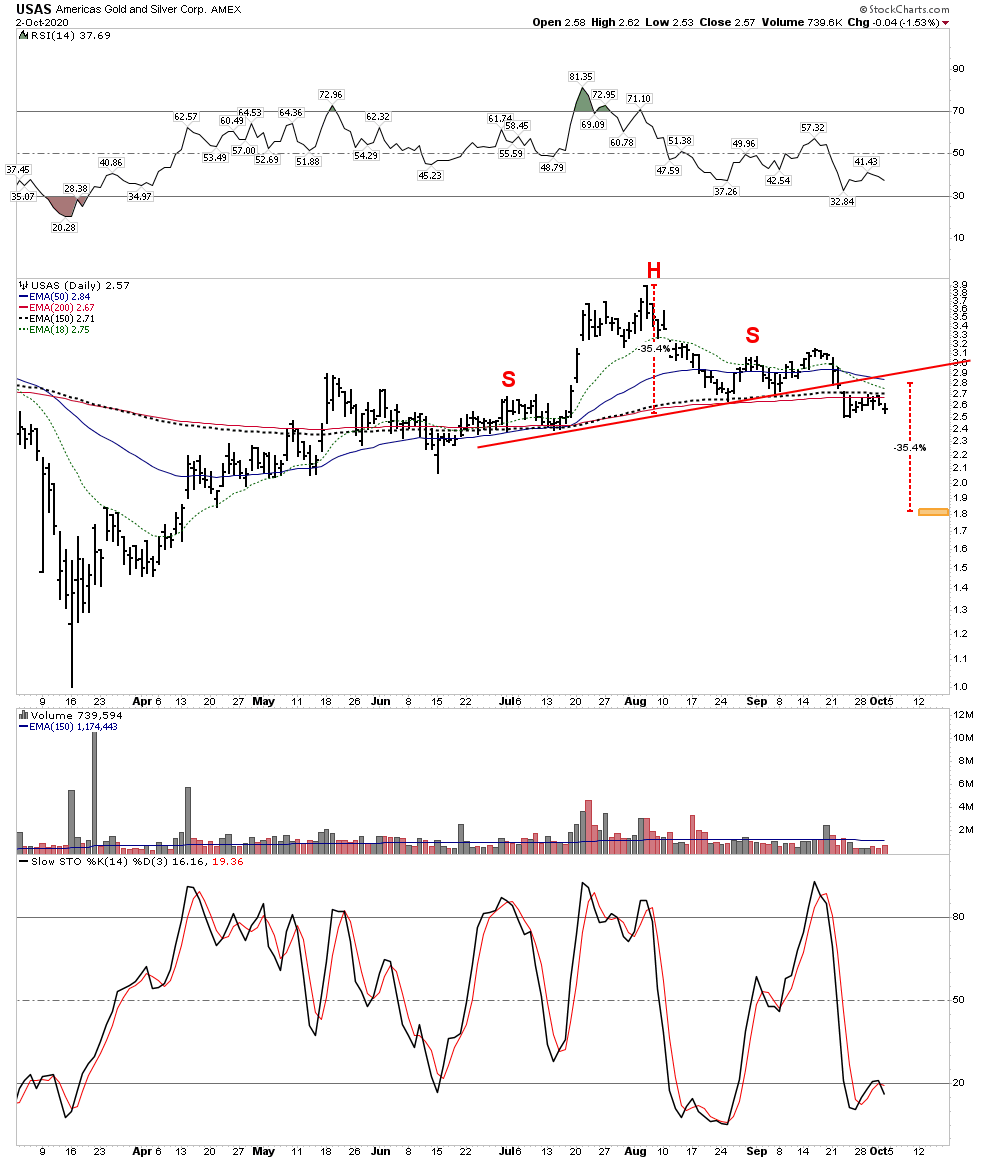
Cant deny these H and S breakdowns
Weinstein says we are ok. Does not mean we cannot get another engineered stop run, followed by a slingshot reversal, as we saw earlier this year.
Could you explain OK. OK meaning according to Weinstein principles or his specific commentary on the G & S sector?
My thinking is I see the underlying bullishness of the sector which translates into quick buying of the dip. It does seem like its often the beach ball under the water phenomenon. However the charts are clearly putting in clean unambiguous price objectives to the downside.
Myself, I am not short and I am trying to remain objective and unbiased. But I don’t like the looks of these charts.
according to Weinstein principles …
Armstrong put out a private note yesterday that Socrates shows a panic cycle in the Dow in the week of 26th October, 3 weeks away. Maybe this will be the dislocation in the markets? Maybe that week will be the PM ICL, which should be bought?
Its a hard choice for the PMs here: Stick with positions, with a possibility of another stop run in the last week of October; or sell here with expectation of buying back in the last week of October?
Eventually the miners are going to start disappointing the bears during pullbacks. Folks are going to miss the bull train because they waited for the painful pullback that never occurred. Has that time arrived? I don’t know, but I think it’s possible. I bought miners last week on that 3 std. deviation day and I’m satisfied with that purchase, even if they do go lower. At this stage in the game, I’d rather be in early than late.
I’m afraid I now have to agree with you, Sir Plunger.
My research also suggests there could be a 15% drawdown from these levels. Not certain, of course, but likely IMO.
I have changed from cautious all in bull to a much more defensive position. Made the portfolio adjustments before market close on Friday.
Fear and Greed. Which is the more powerful emotion? For me, fear is tipping the scales right now.
Thanks for sharing your thoughts.