Symmetry in recent Gold movements
I don’t know if it means anything, but I found it interesting to note the big crash in March which I thought was an anomaly, and the big run up to $2000+ recently both look like they’re connected. Or do we just see things when we look too long at charts?
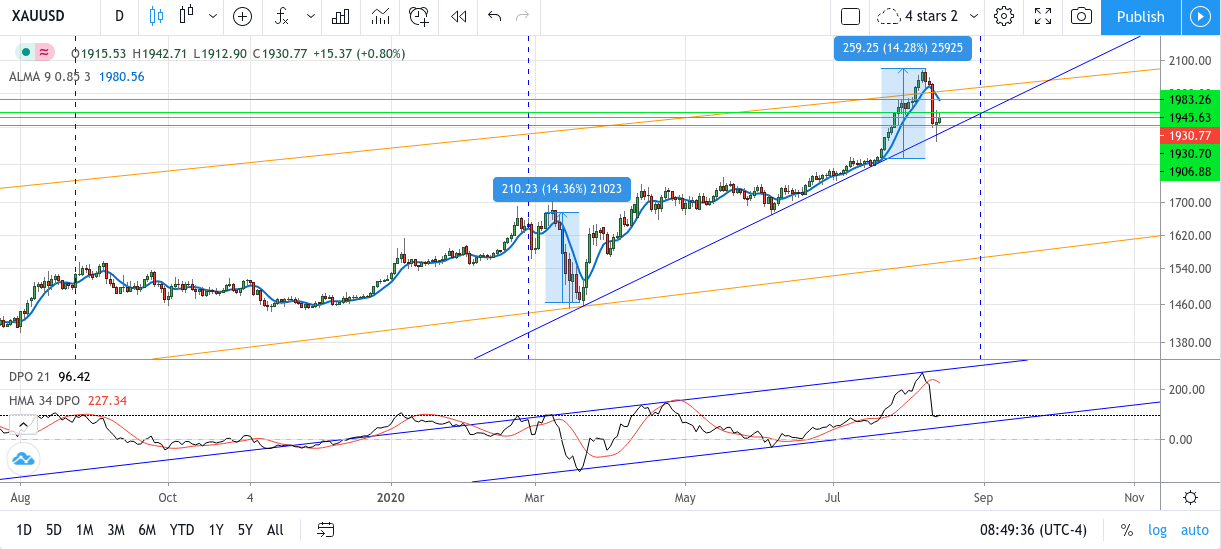
quite right Patrick. Huge anomalies in either direction tend to be ‘corrected’ back closer to the moving average.
Patrick? I take that as a compliment! My wild guess from all this is $2200 by Aug 31st. I saw a similar bar pattern replay in the GSR a year or so ago. It was temporary but it came at a time of major reversal.
So in about two weeks, we’re gonna see $2200 gold? Hmmm…
Excellent trendline Tim…thanks